Fig. 4.
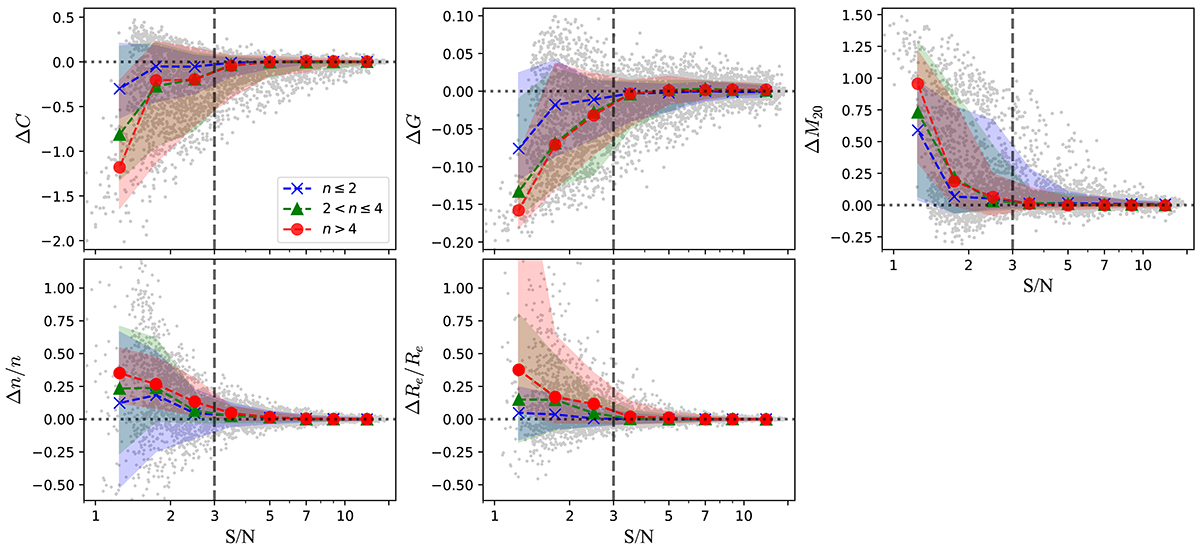
Download original image
Dependence of the morphology indicators uncertainties on S/N, estimated from mock images. The median trends of the mock galaxies with different n are marked with dotted lines; the shaded region indicates the 16th to 84th percentiles. The top row shows the difference between the measured parameters and the intrinsic values, expressed as ΔC = Cmock − Cint. The bottom row shows the difference between the measured and true n and Re values, relative to the true value. The horizontal dotted line at zero indicates perfect agreement between measurements and true values, while the vertical dashed line marks the S/N = 3 boundary beyond which the agreement considerably improves.
Current usage metrics show cumulative count of Article Views (full-text article views including HTML views, PDF and ePub downloads, according to the available data) and Abstracts Views on Vision4Press platform.
Data correspond to usage on the plateform after 2015. The current usage metrics is available 48-96 hours after online publication and is updated daily on week days.
Initial download of the metrics may take a while.