Open Access
Fig. 3.
Download original image
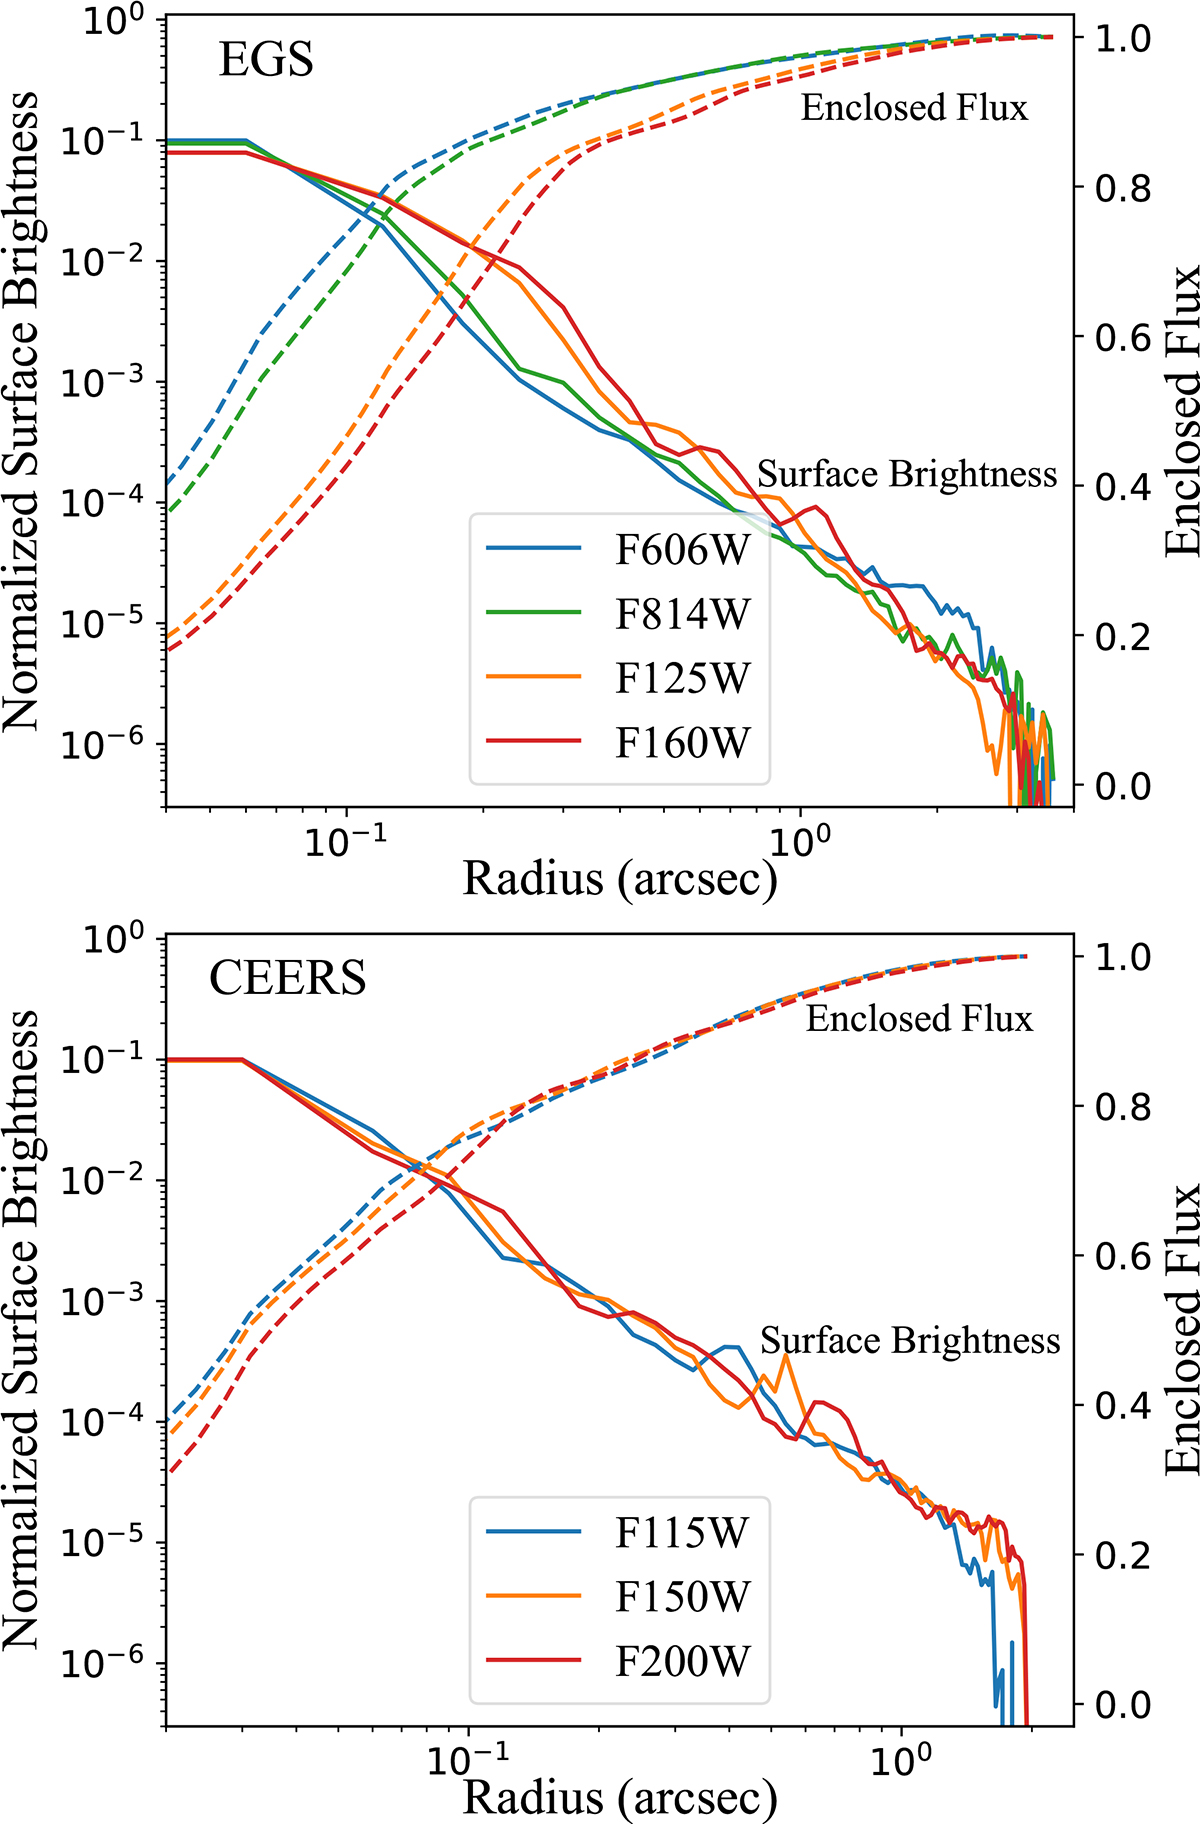
Normalised surface brightness profiles (solid line) and the growth curves (dashed line) of the PSF models for EGS (top) and CEERS (bottom), colour-coded with different filters. The growth curves were normalised to the total flux of the PSF model within 7.2″ (EGS) and 3.9″ (CEERS).
Current usage metrics show cumulative count of Article Views (full-text article views including HTML views, PDF and ePub downloads, according to the available data) and Abstracts Views on Vision4Press platform.
Data correspond to usage on the plateform after 2015. The current usage metrics is available 48-96 hours after online publication and is updated daily on week days.
Initial download of the metrics may take a while.