Fig. 2.
Download original image
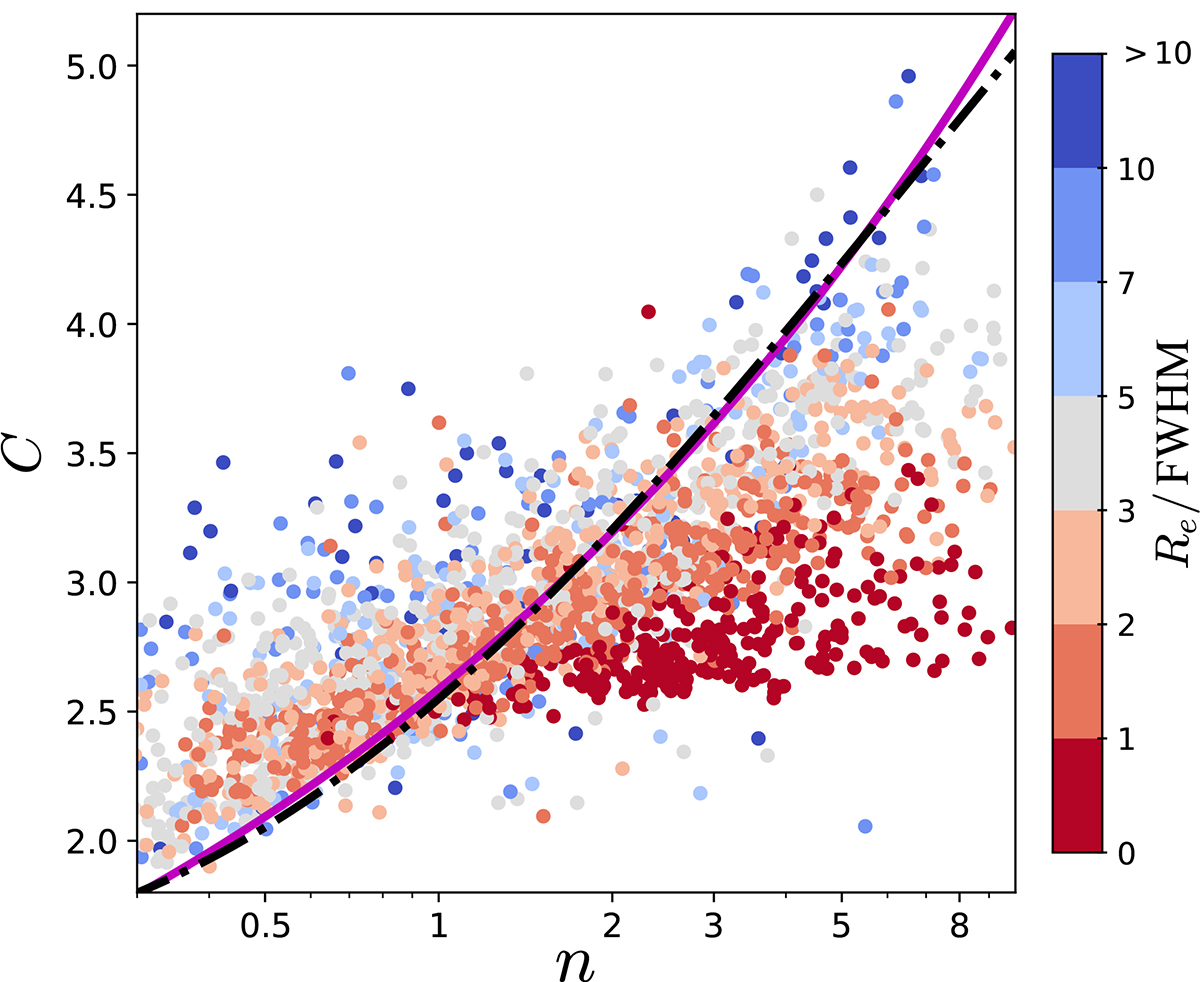
Correlation between the concentration index and the Sérsic index for the EGS images. The dot-dashed black curve is the numerical relationship derived by integrating the best-fit Sérsic model out to 1.5Rp. The solid purple curve is the empirical relationship of Eq. (5). The colour of the points marks the relative size of the galaxies (Re/FWHM). The data points generally agree with the numerical expectation, but showing large scatters, especially for the galaxies with smaller relative sizes (Re/FWHM ≤ 1).
Current usage metrics show cumulative count of Article Views (full-text article views including HTML views, PDF and ePub downloads, according to the available data) and Abstracts Views on Vision4Press platform.
Data correspond to usage on the plateform after 2015. The current usage metrics is available 48-96 hours after online publication and is updated daily on week days.
Initial download of the metrics may take a while.