Open Access
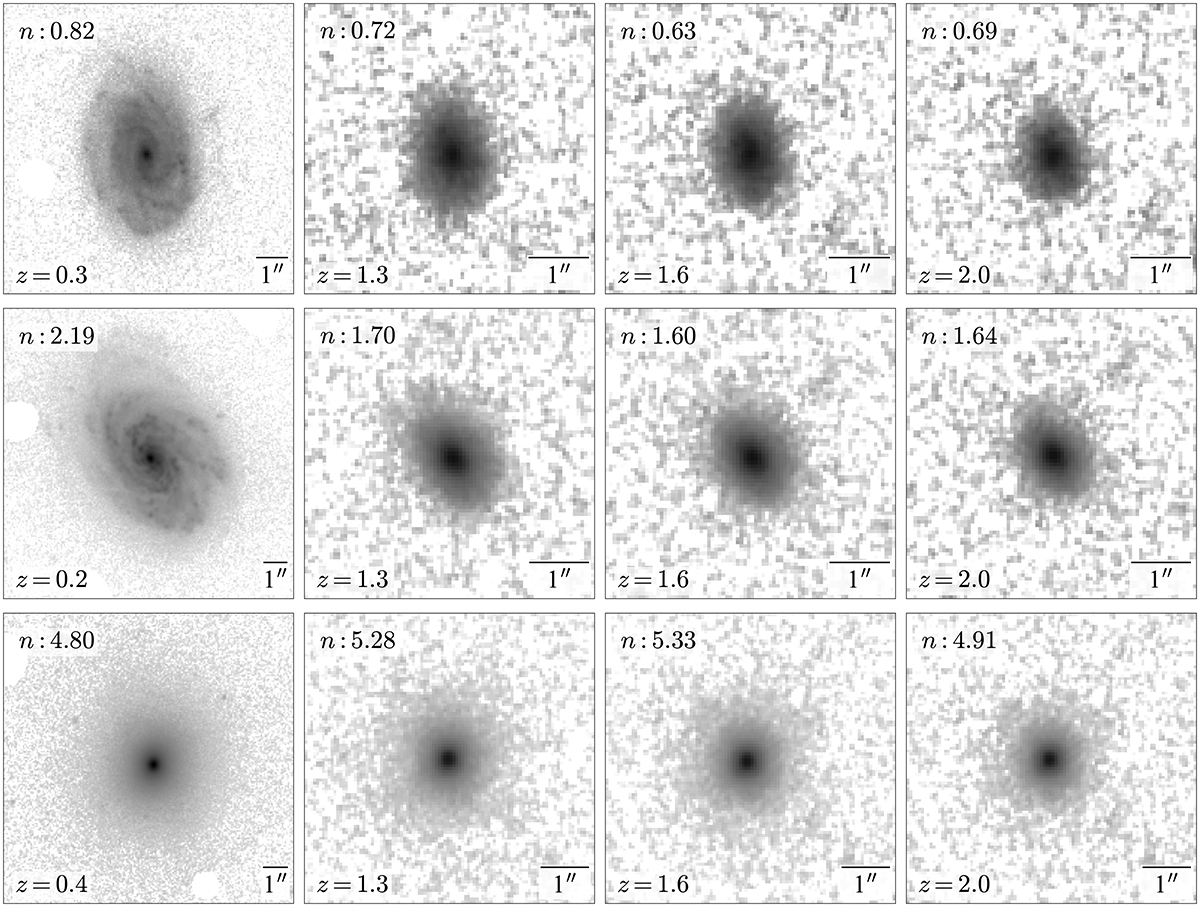
Fig. 16.
Download original image
Examples of the artificially redshifted galaxies in the HST observation. The original low-redshift galaxy is shown in the left column, with the right three columns showing the high-redshift mock images. The best-fit Sérsic index is also labelled in each panel.
Current usage metrics show cumulative count of Article Views (full-text article views including HTML views, PDF and ePub downloads, according to the available data) and Abstracts Views on Vision4Press platform.
Data correspond to usage on the plateform after 2015. The current usage metrics is available 48-96 hours after online publication and is updated daily on week days.
Initial download of the metrics may take a while.