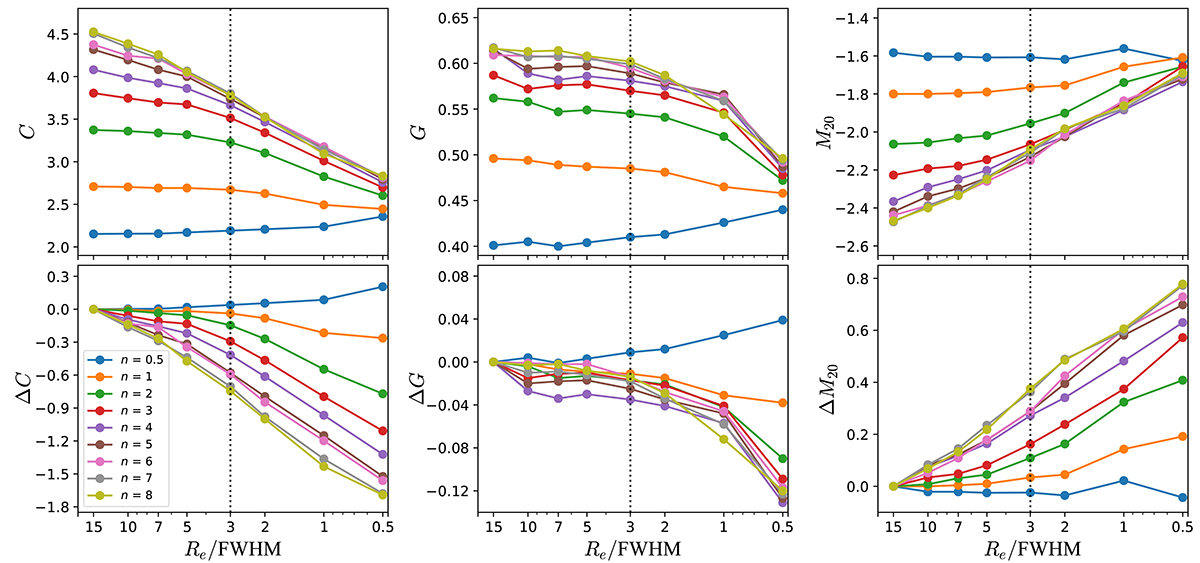
Fig. 15.
Download original image
Measured C (left), G (middle), and M20 (right) as a function of Re/FWHM, with different colours representing different Sérsic indices. The top and bottom rows show the directly measured structural parameter (C, G, and M20) and the deviation from the intrinsic values (ΔC, ΔG, and ΔM20), respectively. As the galaxy becomes smaller, C, G, and M20 gradually converge to the corresponding values of the PSF.
Current usage metrics show cumulative count of Article Views (full-text article views including HTML views, PDF and ePub downloads, according to the available data) and Abstracts Views on Vision4Press platform.
Data correspond to usage on the plateform after 2015. The current usage metrics is available 48-96 hours after online publication and is updated daily on week days.
Initial download of the metrics may take a while.