Fig. 11.
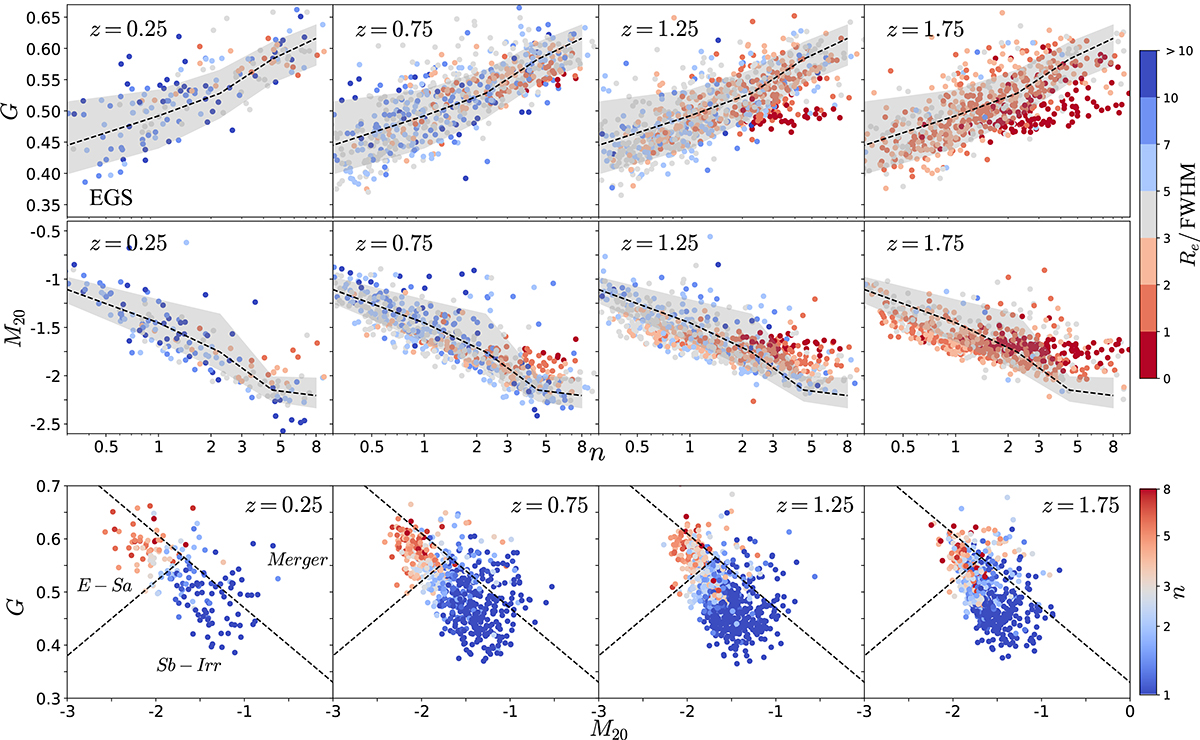
Download original image
Measured G (top row) and M20 (middle row) for the EGS images at 0 < z < 2 as a function of n. In each panel, the dashed black line shows the median trend for the Re/FWHM > 5 sub-samples at z < 1 (left two columns), with the grey-shaded region indicating the 16th to 84th percentile range of the variation. The distributions of galaxies in our sample at different redshift ranges in the G-M20 space are shown in the bottom row, colour-coded by the Sérsic index. The dashed lines are the boundaries between different galaxy types (Merger, E-Sa, and Sb-Irr) derived from Lotz et al. (2008).
Current usage metrics show cumulative count of Article Views (full-text article views including HTML views, PDF and ePub downloads, according to the available data) and Abstracts Views on Vision4Press platform.
Data correspond to usage on the plateform after 2015. The current usage metrics is available 48-96 hours after online publication and is updated daily on week days.
Initial download of the metrics may take a while.