Fig. 1.
Download original image
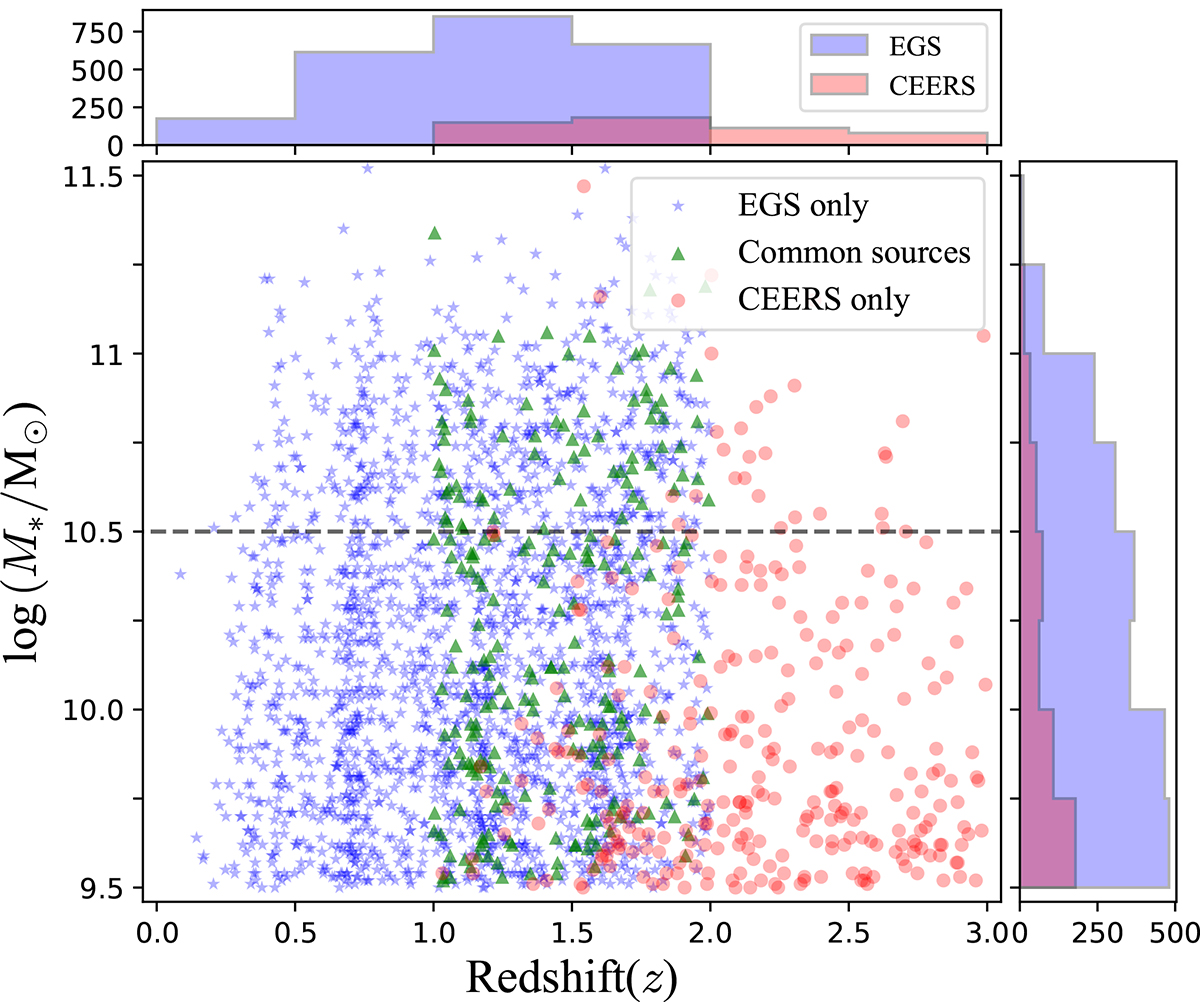
Mass and redshift distribution of the galaxies in our sample. The blue stars indicate galaxies in the EGS images, and the red circles indicate galaxies in the CEERS images. The green triangles indicate the common sources between the EGS and CEERS images. The dashed horizontal line at log(M*/M⊙) = 10.5 indicates the boundary between the high-mass galaxies and low-mass galaxies in this study.
Current usage metrics show cumulative count of Article Views (full-text article views including HTML views, PDF and ePub downloads, according to the available data) and Abstracts Views on Vision4Press platform.
Data correspond to usage on the plateform after 2015. The current usage metrics is available 48-96 hours after online publication and is updated daily on week days.
Initial download of the metrics may take a while.