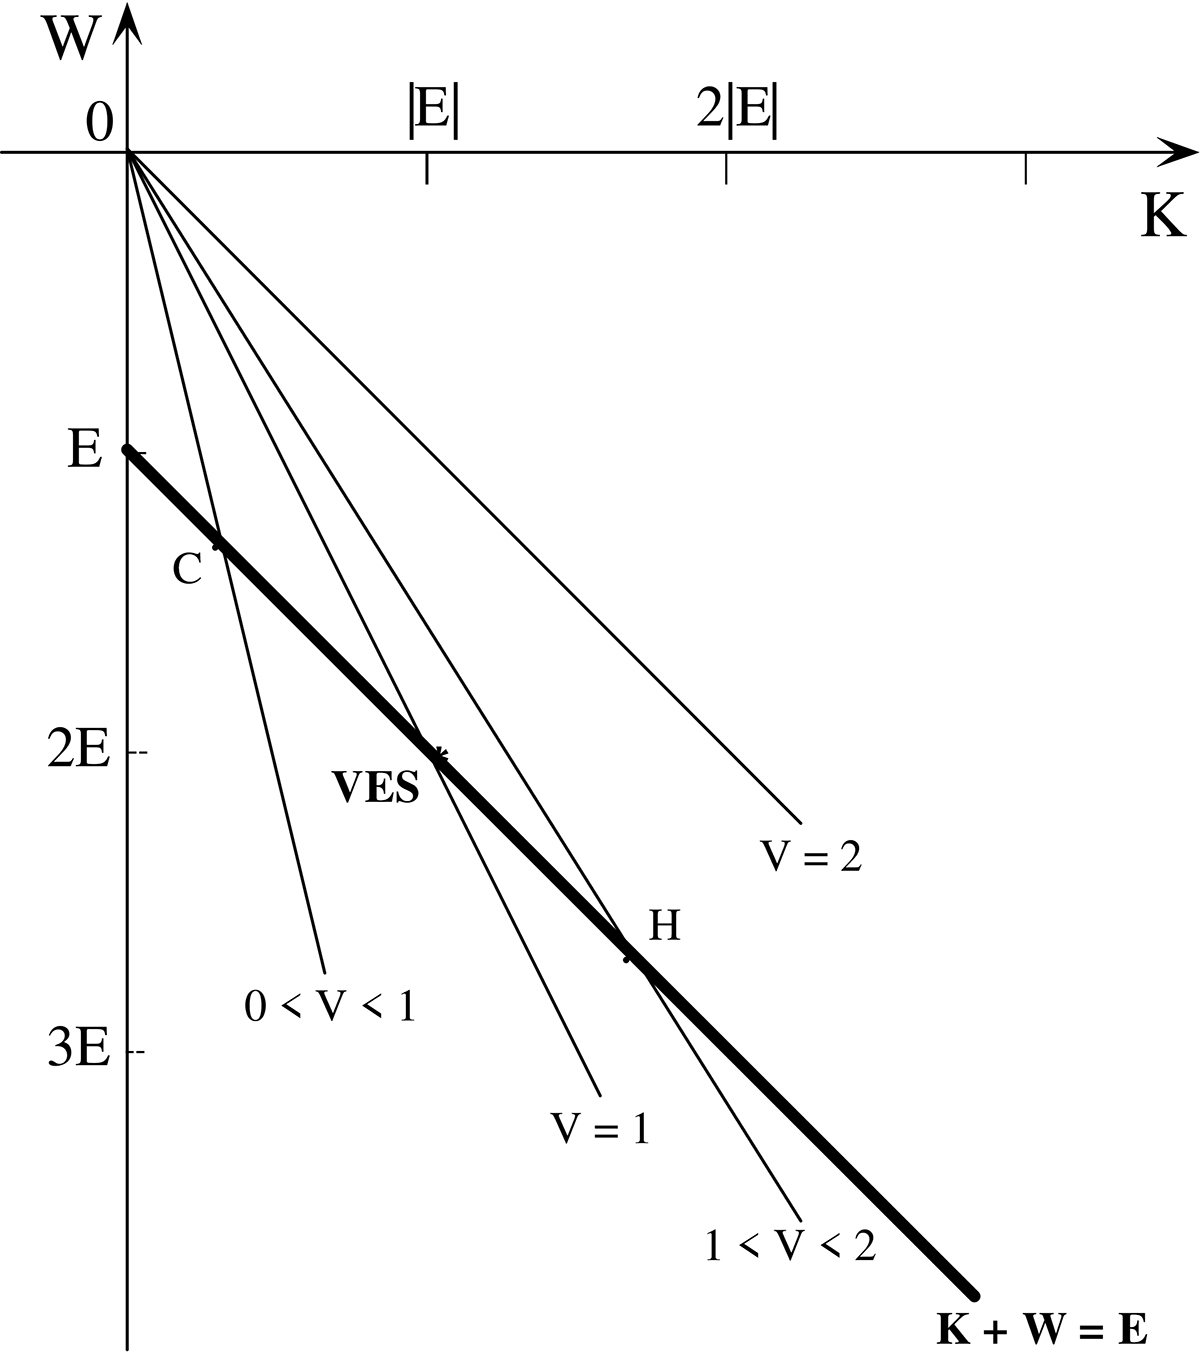
Fig. 1.
Download original image
Representation of the dynamic evolution of a system on a diagram connecting kinetic, K, and potential energy, W. Evolution occurs along the straight line K(t)+W(t) = E, approaching on average a virial equilibrium state (VES). The thin lines correspond to fixed values of the virial ratio V given by Eq. (6). The letters C and H denote cold and hot configurations, which are characterized by the values K < |E| and K > |E|, respectively.
Current usage metrics show cumulative count of Article Views (full-text article views including HTML views, PDF and ePub downloads, according to the available data) and Abstracts Views on Vision4Press platform.
Data correspond to usage on the plateform after 2015. The current usage metrics is available 48-96 hours after online publication and is updated daily on week days.
Initial download of the metrics may take a while.