Fig. 9
Download original image
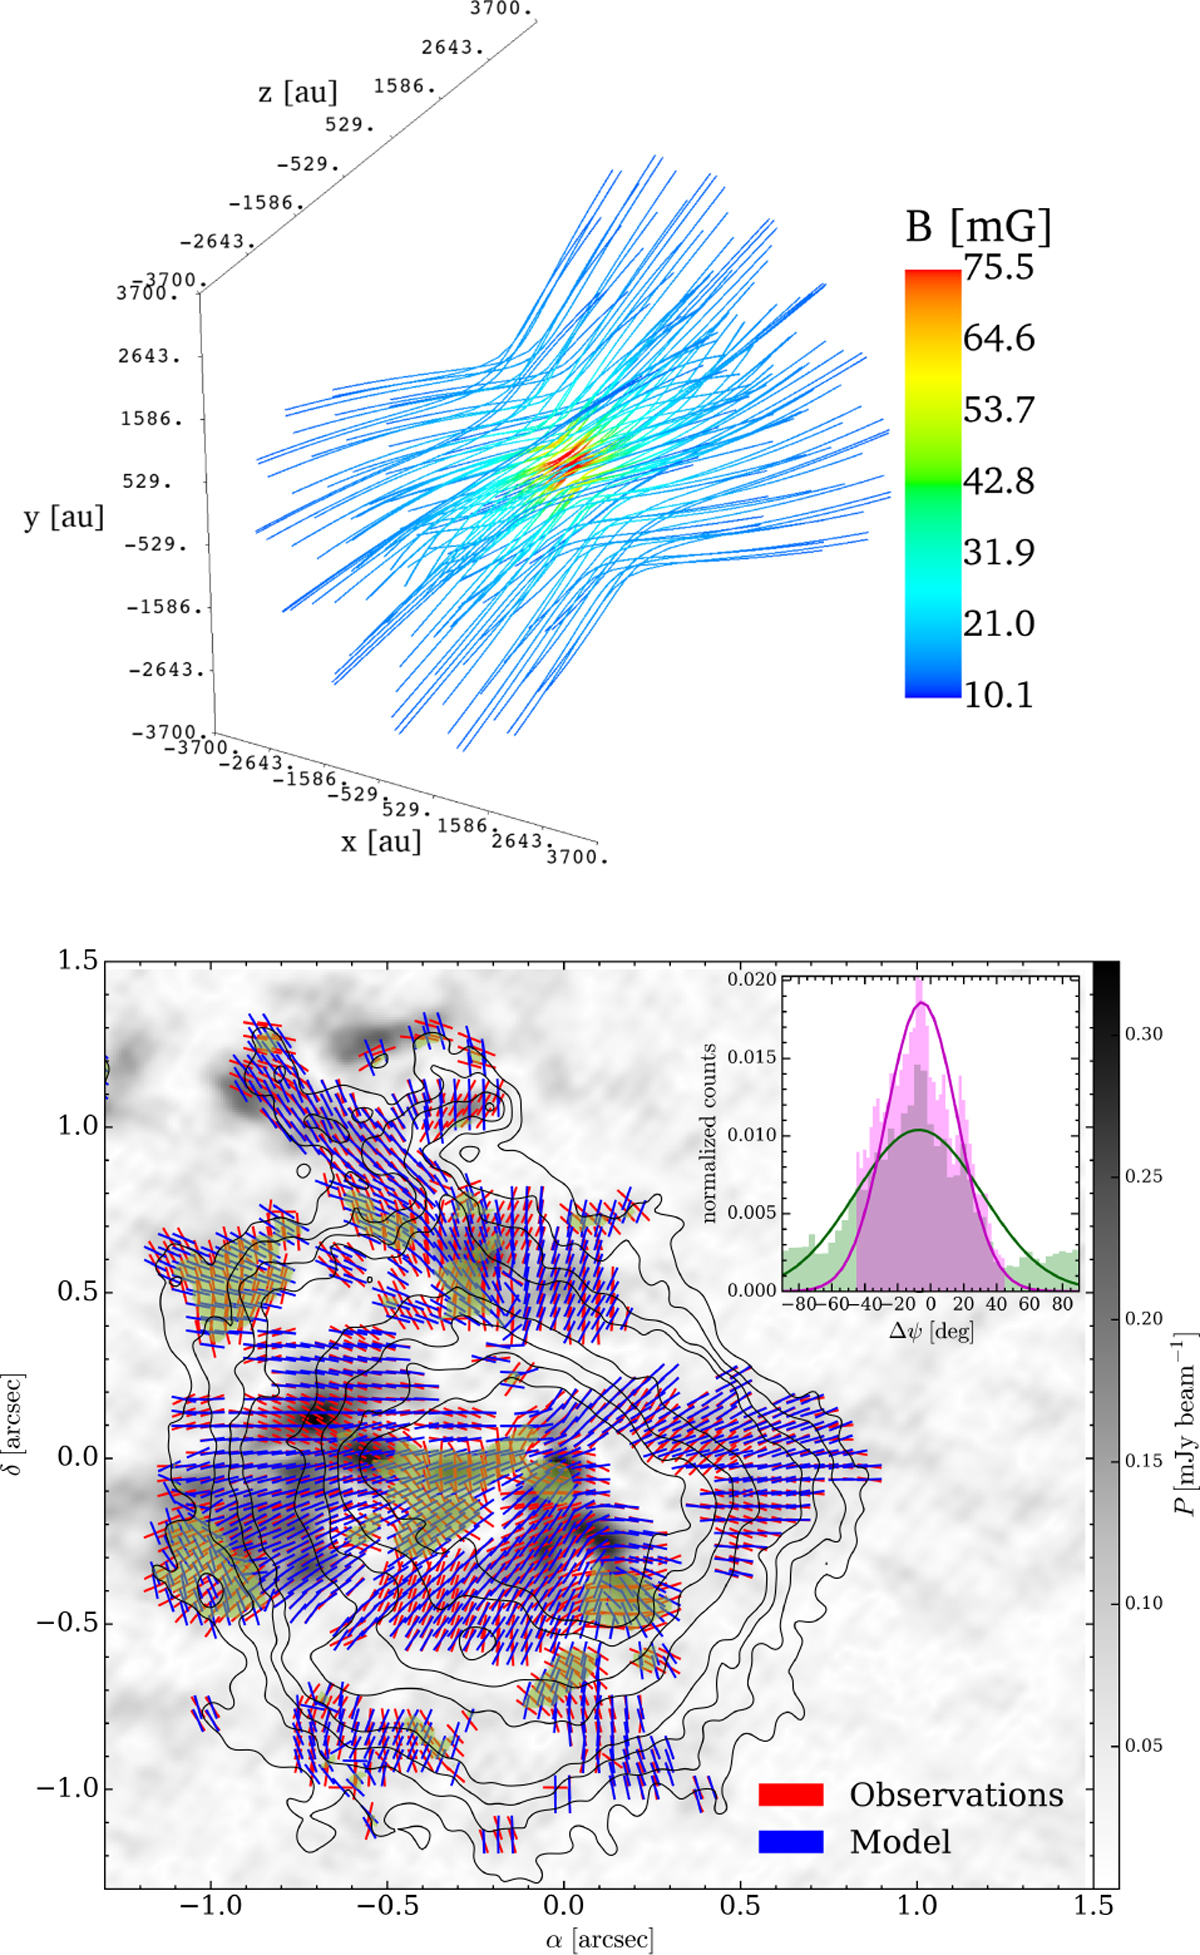
Comparison of magnetic field orientations between model and observations. Upper panel: magnetic field configuration inside a radius of 3700 au, corresponding to the radius of the Main core in G31, obtained with b0 = 0.1, λ = 2.66, i = 50°, and ϕ = −63°. Lower panel: magnetic field segments from observations at 1.3 mm (red) and the best model (blue). The grey-scale map shows the polarized intensity, P, while black contours show the 1.3 mm dust emission at 5, 10, 30, 60, 120, 160, and 200 times σ, which is 0.15 mJy beam−1. Yellow areas show the regions where the difference between the observed and modeled polarization angle is |Δψ| > 45°. The inset shows the distribution of the polarization angle residuals obtained considering the whole range of Δψ (green) and limited to |Δψ| ≤ 45 deg (magenta). The solid lines show the corresponding Gaussian fits to the histograms.
Current usage metrics show cumulative count of Article Views (full-text article views including HTML views, PDF and ePub downloads, according to the available data) and Abstracts Views on Vision4Press platform.
Data correspond to usage on the plateform after 2015. The current usage metrics is available 48-96 hours after online publication and is updated daily on week days.
Initial download of the metrics may take a while.