Fig. 7
Download original image
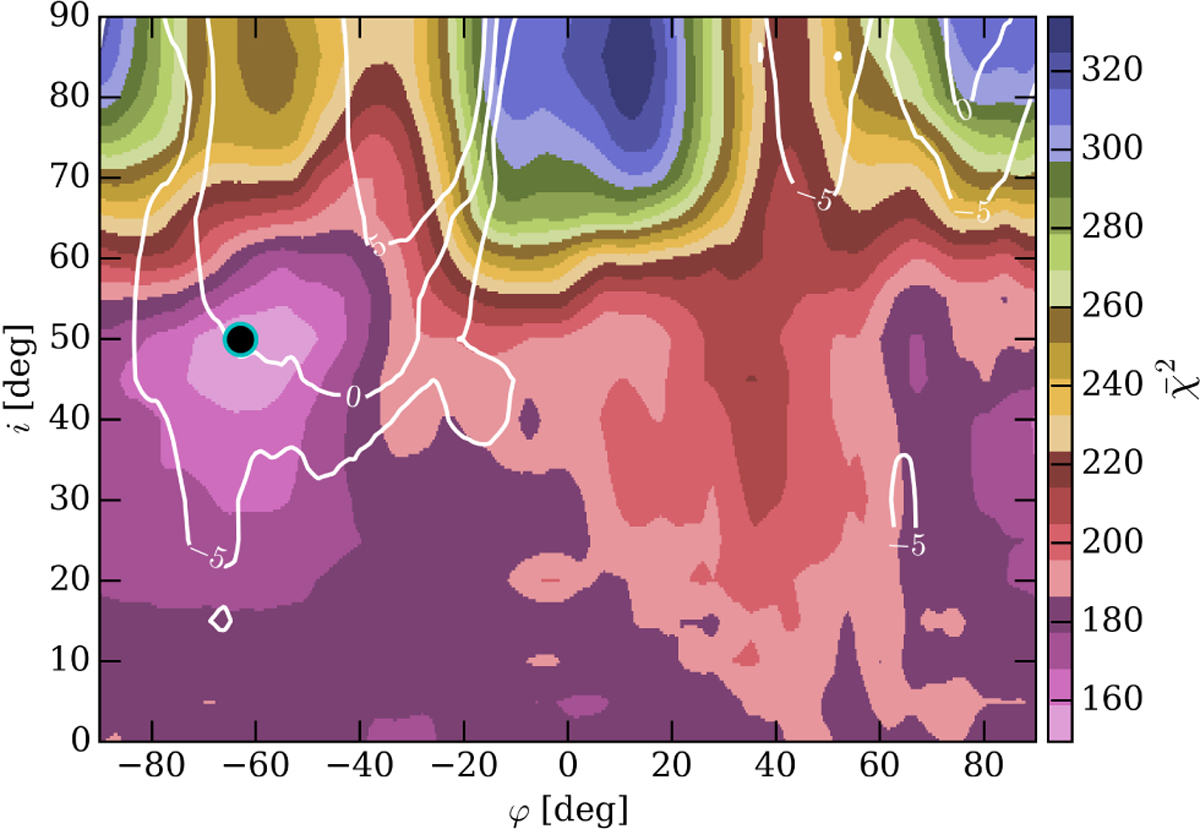
educed chi-squared values,![]() , for 1.3 mm observations as a function of the inclination (i) and the orientation of the projection of the magnetic axis on the plane of the sky (φ). Black isocontours show values of the difference between the observed and modeled position angles, ∆ψ, between −10° and 10° in steps of 5°. The black-filled cyan circle shows the position of the
, for 1.3 mm observations as a function of the inclination (i) and the orientation of the projection of the magnetic axis on the plane of the sky (φ). Black isocontours show values of the difference between the observed and modeled position angles, ∆ψ, between −10° and 10° in steps of 5°. The black-filled cyan circle shows the position of the ![]() minimum.
minimum.
Current usage metrics show cumulative count of Article Views (full-text article views including HTML views, PDF and ePub downloads, according to the available data) and Abstracts Views on Vision4Press platform.
Data correspond to usage on the plateform after 2015. The current usage metrics is available 48-96 hours after online publication and is updated daily on week days.
Initial download of the metrics may take a while.