Fig. 5
Download original image
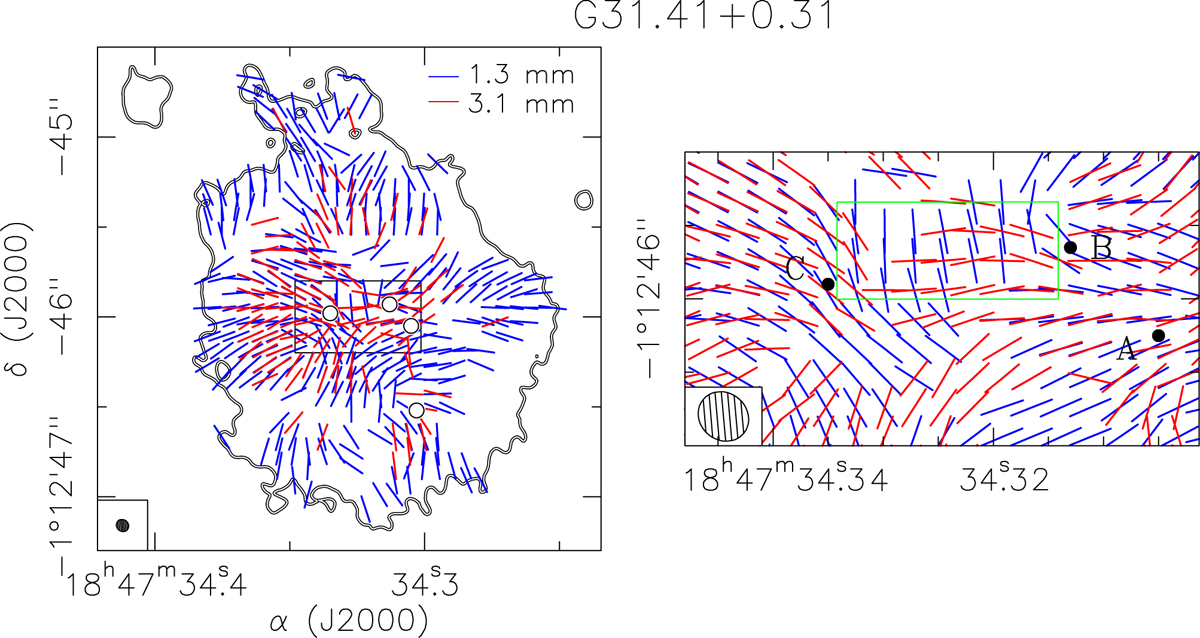
Comparison of magnetic field orientations at 1.3 mm and 3.1 mm. Left: Magnetic field segments at 1.3 mm (blue) and 3.1 mm (red). Segments shown every ten pixels. Contours show the 5σ-level dust continuum emission at 1.3 mm. The synthesized beam is shown in the lower left corner. The black rectangle indicates the zoomed region shown in the right panel. Right: Close-up of the central region toward sources A, B, and C. Segments are shown every five pixels. The green rectangle shows the region where the polarization segments at 1.3 mm and 3.1 mm are almost perpendicular.
Current usage metrics show cumulative count of Article Views (full-text article views including HTML views, PDF and ePub downloads, according to the available data) and Abstracts Views on Vision4Press platform.
Data correspond to usage on the plateform after 2015. The current usage metrics is available 48-96 hours after online publication and is updated daily on week days.
Initial download of the metrics may take a while.