Fig. 4
Download original image
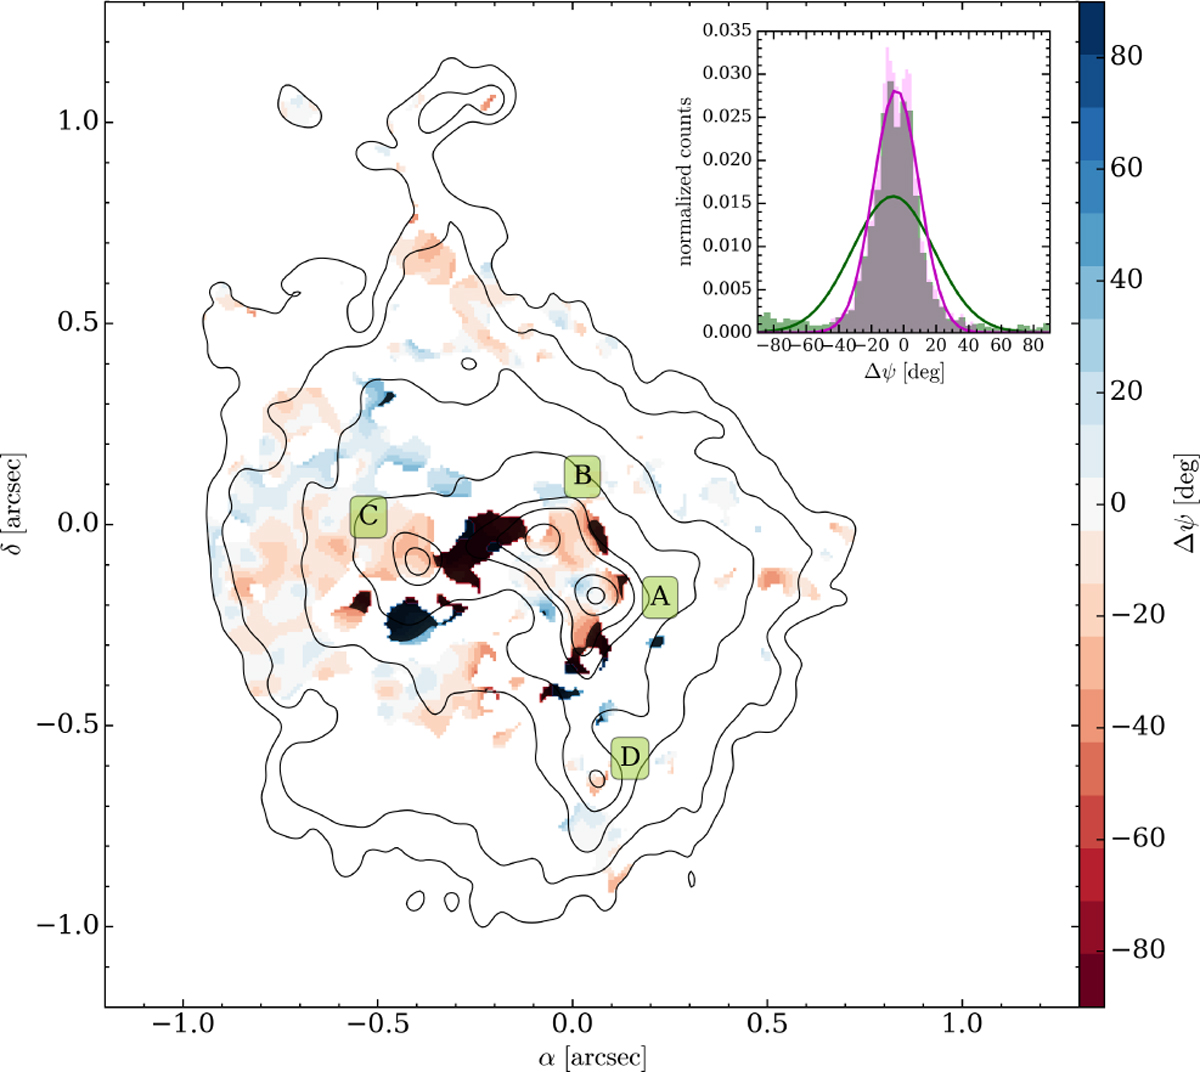
Difference between the polarization angles at 1.3 mm and 3.1 mm. Polarization angle residuals (colors) between the 1.3 mm and 3.1 mm observations, superposed to the 3.1 mm dust continuum emission (contours). Contour levels are the same as in Fig. 1. The letters (A, B, C, D) show the position of four embedded continuum sources listed in Table 1. The hatched areas show the regions where |Δψ| > 45o. The inset shows the distribution of the polarization angle residuals obtained considering the whole range of Δψ (green) and limited to |Δψ| ≤ 45o (magenta). The solid lines show the corresponding Gaussian fits to the histograms whose mean value and standard deviation are −6.43o ± 25.22° and −4.45o ± 14.15°, respectively.
Current usage metrics show cumulative count of Article Views (full-text article views including HTML views, PDF and ePub downloads, according to the available data) and Abstracts Views on Vision4Press platform.
Data correspond to usage on the plateform after 2015. The current usage metrics is available 48-96 hours after online publication and is updated daily on week days.
Initial download of the metrics may take a while.