Fig. 3
Download original image
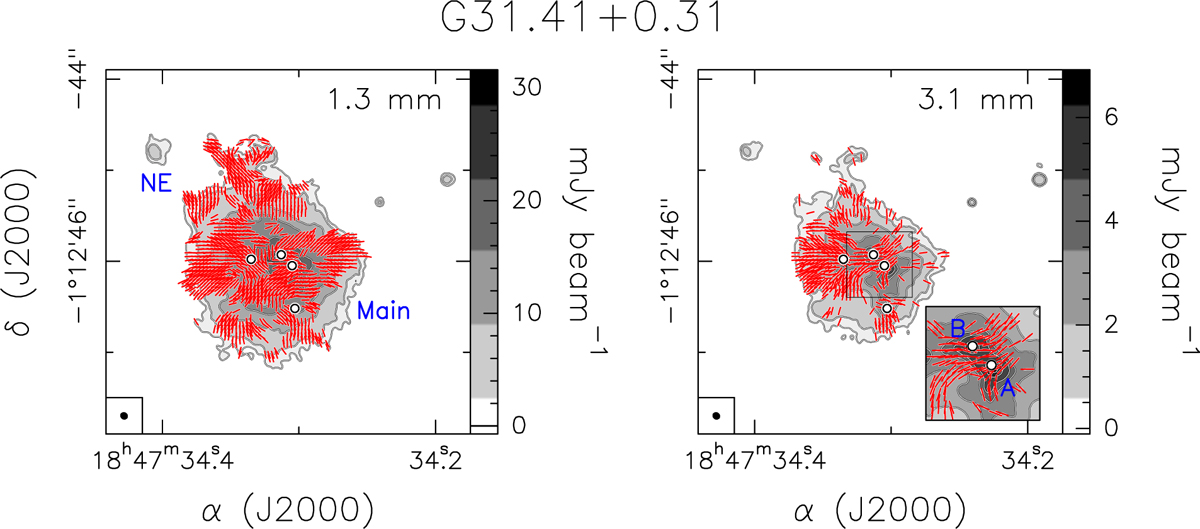
Magnetic field orientation at both wavelengths. Magnetic field segments (red lines) at 1.3 mm (left) and 3.1 mm (right) overlaid on the corresponding Stokes I maps (contours and greyscale). Segments are shown every five pixels. The white dots mark the position of four embedded continuum sources observed at 1.4 mm and 3.5 mm (Beltrán et al. 2021). The black rectangle (right) indicates the zoomed region shown in the inset. Contours are the same as in Fig. 1. The synthesized beam is shown in the lower left corner.
Current usage metrics show cumulative count of Article Views (full-text article views including HTML views, PDF and ePub downloads, according to the available data) and Abstracts Views on Vision4Press platform.
Data correspond to usage on the plateform after 2015. The current usage metrics is available 48-96 hours after online publication and is updated daily on week days.
Initial download of the metrics may take a while.