Fig. 2
Download original image
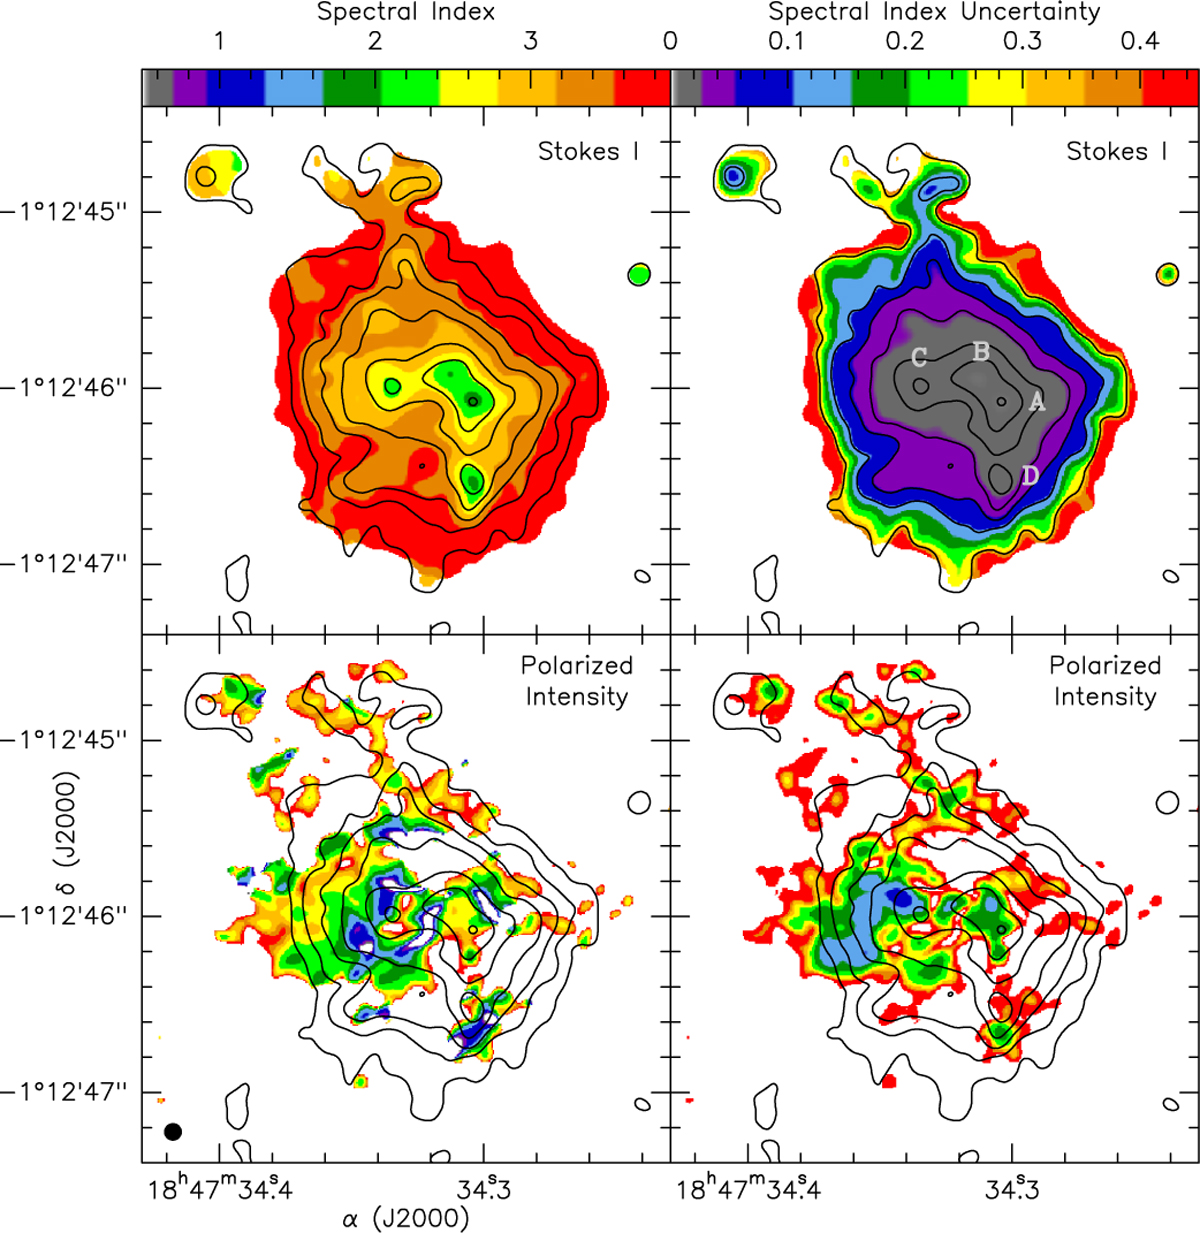
Spectral indices. Color images of the spectral indices between 3.1 and 1.3 mm of the Stokes I (left top panel) and of the polarized intensity (left bottom panel). The associated uncertainties images are shown in the right panels. The scale is the same for the two images (shown in the wedge at the top of the panels). The contours in both panels show the Stokes I emission at 3.1 mm. Contours are 1, 3, 6, 12, 24, 48 and 96% of the peak intensity, 12 mJy beam−1. The images presented here were obtained using a common uv-range for the 3.1 and 1.3 mm data (see text).
Current usage metrics show cumulative count of Article Views (full-text article views including HTML views, PDF and ePub downloads, according to the available data) and Abstracts Views on Vision4Press platform.
Data correspond to usage on the plateform after 2015. The current usage metrics is available 48-96 hours after online publication and is updated daily on week days.
Initial download of the metrics may take a while.