Fig. 13
Download original image
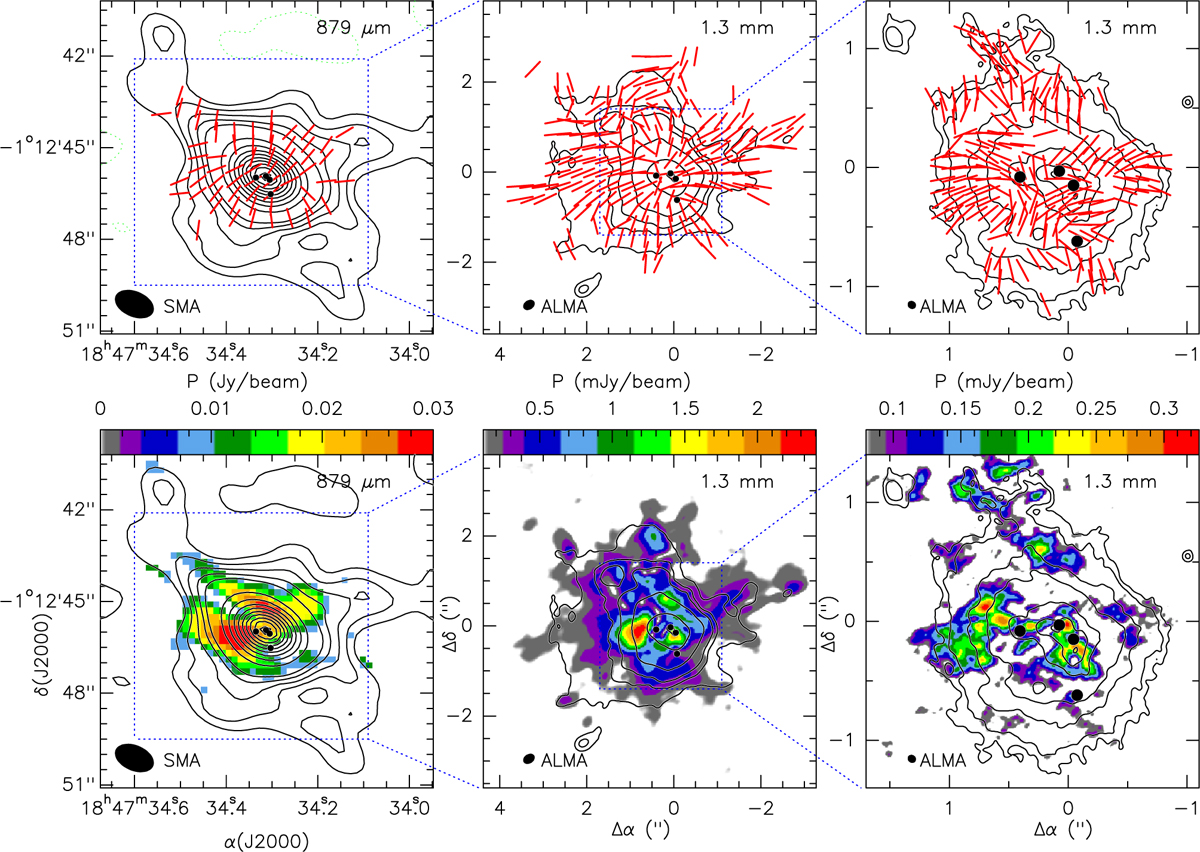
Comparison of the Stokes I emission, magnetic field segments, and polarized intensity P of G31 at different wavelengths and angular resolution. Top panels: magnetic field segments (red) overlaid on the Stokes I (contours) at (left) 879 µm observed with the SMA and a synthesized beam of 1″.34×0″.83 by Girart et al. (2009), (middle) 1.3 mm with ALMA and a synthesized beam of 0″.28×0″.20 by Beltrán et al. (2019), and (right) 1.3 mm with ALMA and a synthesized beam of 0″.072×0″.064 (this work). Contours levels are −0.8%, 0.8%, 1.5%, 2.5%, 4% and 6% to 96% in steps of 10% of the peak intensity, which is 9.13 Jy beam−1 (left), −5, 5, 10, 15, 40, 160, and 300 times σ, where 1σ is 1.2 mJy beam−1 (middle), and −5, 5, 10, 30, 60, 120, 160, and 200 times σ, where 1σ is 0.15 mJy beam−1 (right). The synthesized beams are shown in the lower left corner. Black dots mark the position of four embedded continuum sources (Beltrán et al. 2021). Bottom panels: contour map of the Stokes I emission superposed on the color image of the polarized flux intensity P.
Current usage metrics show cumulative count of Article Views (full-text article views including HTML views, PDF and ePub downloads, according to the available data) and Abstracts Views on Vision4Press platform.
Data correspond to usage on the plateform after 2015. The current usage metrics is available 48-96 hours after online publication and is updated daily on week days.
Initial download of the metrics may take a while.