Fig. 1
Download original image
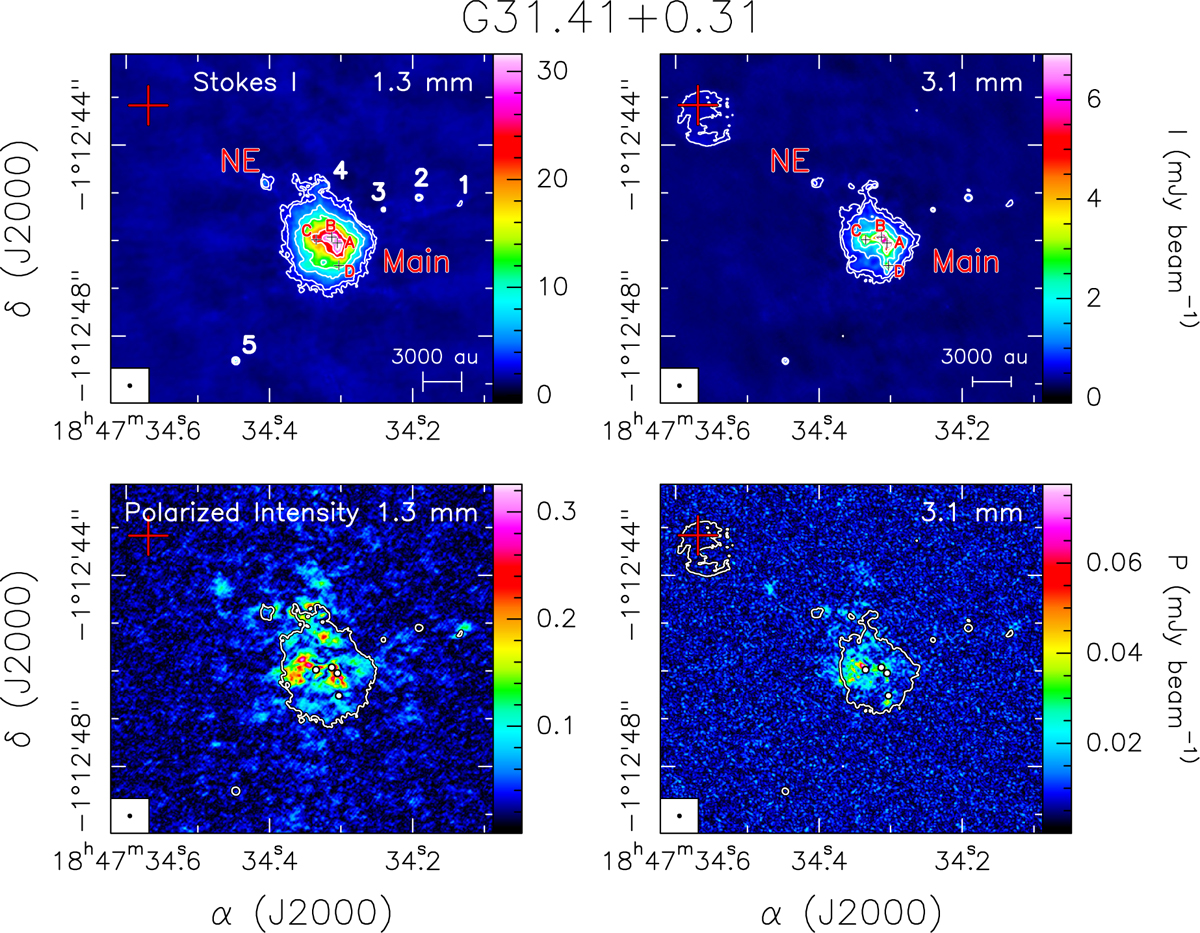
Stokes I and polarized intensity at both wavelengths in G31. Top panels: ALMA Stokes I map of the G31 HMC at 1.3 mm (left) and 3.1 mm (right). The contours are −5, 5, 10, 30, 60, 120, 160, and 200 times σ at 1.3 mm and −5, 5, 10, 30, 60, 120, 160, 240 and 320 times σ at 3.1 mm, where 1σ is 0.15 mJy beam−1 and 0.02 mJy beam−1, at 1.3 mm and 3.1 mm, respectively. Crosses (top panels) and white dots (lower panels) mark the position of four continuum sources embedded in the Main core, named A, B, C, and D, observed at 1.4 mm and 3.5 mm (Beltrán et al. 2021). White numbers indicate the other continuum sources identified in the region by Beltrán et al. (2021). The red cross indicates the peak of the UC HII region imaged by Cesaroni et al. (1994). The synthesized beam is shown in the lower left corner. Bottom panels: Linearly polarized intensity P (colors) and dust continuum emission map (contours) at 1.3 mm (left) and 3.1 mm (right). 1σ is 8.1 µJy beam−1 and 2.6 µJy beam−1, at 1.3 mm and 3.1 mm, respectively. The contours indicate the 5σ level of Stokes I at each wavelength.
Current usage metrics show cumulative count of Article Views (full-text article views including HTML views, PDF and ePub downloads, according to the available data) and Abstracts Views on Vision4Press platform.
Data correspond to usage on the plateform after 2015. The current usage metrics is available 48-96 hours after online publication and is updated daily on week days.
Initial download of the metrics may take a while.