Open Access
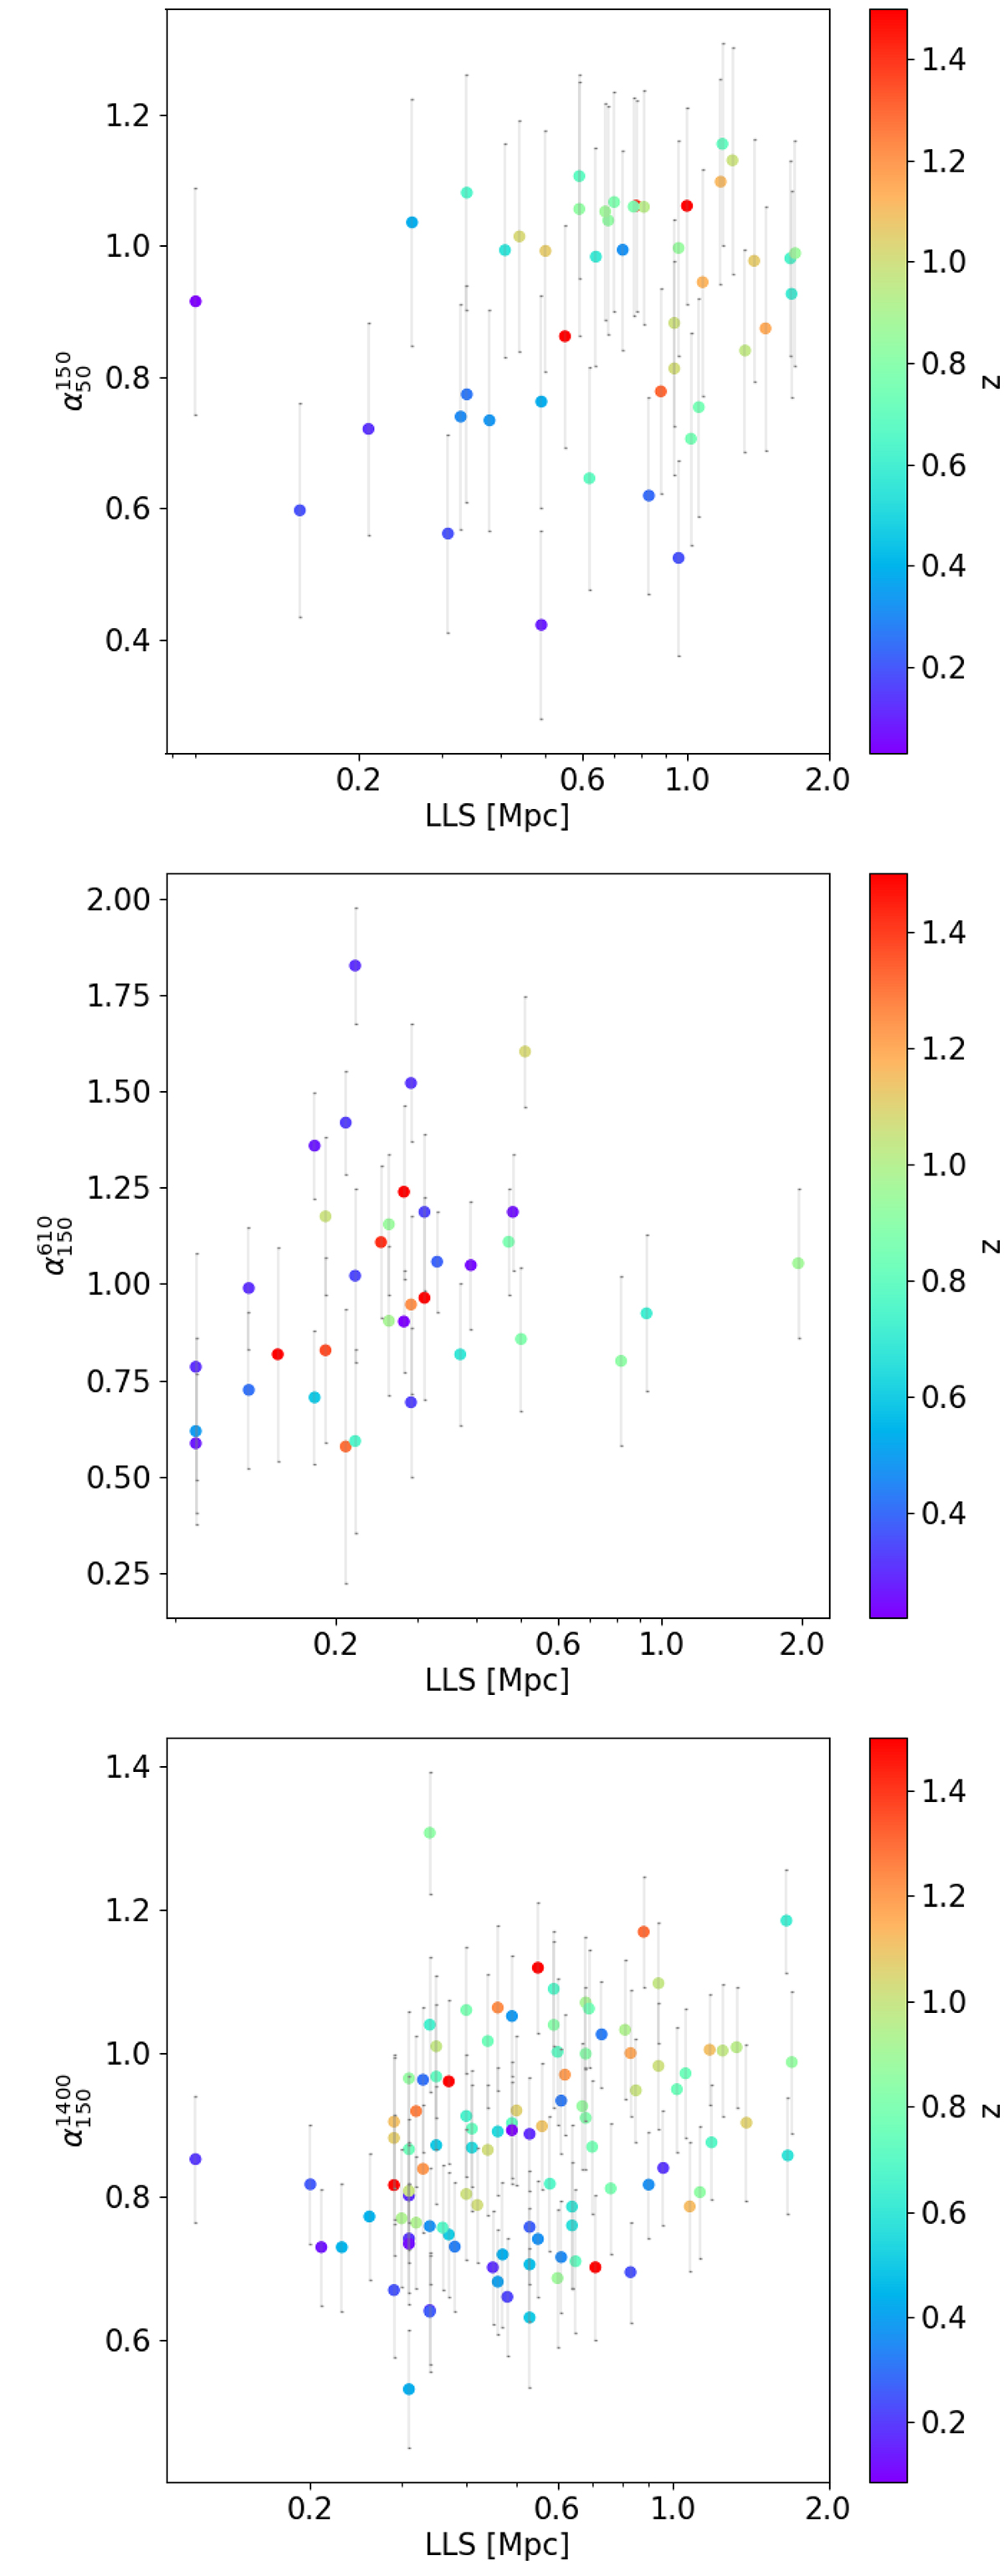
Fig. 10.
Download original image
Relation between the integrated spectral index, calculated in the range 50−150 MHz (upper panel), 150−610 MHz (middle panel) and 150−1400 MHz (lower panel), and the largest linear size of RGs. The colorbar highlights the redshift of the sources, while the errorbars represent the error on the spectral index.
Current usage metrics show cumulative count of Article Views (full-text article views including HTML views, PDF and ePub downloads, according to the available data) and Abstracts Views on Vision4Press platform.
Data correspond to usage on the plateform after 2015. The current usage metrics is available 48-96 hours after online publication and is updated daily on week days.
Initial download of the metrics may take a while.