Open Access
Fig. 7.
Download original image
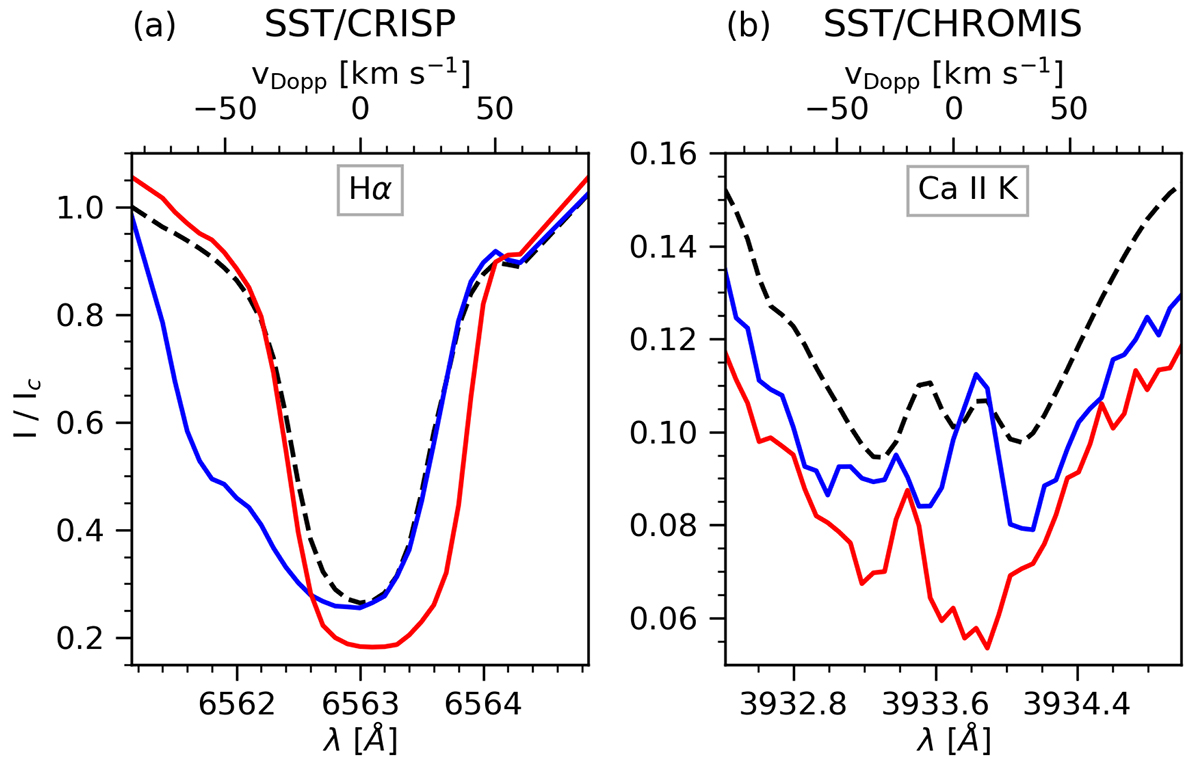
Surge representative spectra for Hα (panel a) and Ca II K (panel b) at ∼08:48 UT. The blue and red curves are the profiles corresponding to the locations, respectively, indicated by the blue and red diamonds in Fig. 1. The black dashed line is a reference profile that is the average over the whole FOV of the observation.
Current usage metrics show cumulative count of Article Views (full-text article views including HTML views, PDF and ePub downloads, according to the available data) and Abstracts Views on Vision4Press platform.
Data correspond to usage on the plateform after 2015. The current usage metrics is available 48-96 hours after online publication and is updated daily on week days.
Initial download of the metrics may take a while.