Fig. 6.
Download original image
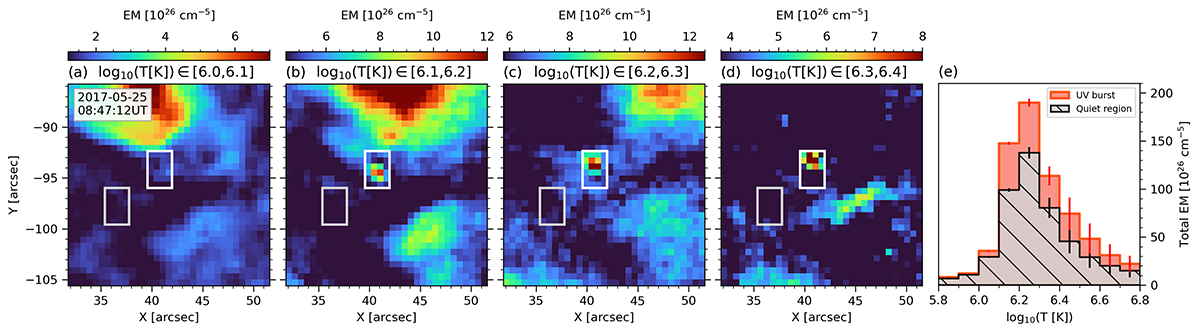
Emission measure (EM) results applying the method by Plowman & Caspi (2020) on the original SDO/AIA data at 08:47:12 UT. Panels (a)–(d) show the EM maps integrated within the four distinct temperature bins specified in the respective labels. The white rectangle centered on (X, Y) = (41″, −94″) outlines the EUV counterpart of the UV burst, while the gray rectangle delimits a quiet region for comparison. Panel (e) contains the total EM within these two rectangles against temperature, where the associated errors are indicated as vertical lines. An animation of this figure is available online showing the time evolution from 08:35 to 09:00 UT.
Current usage metrics show cumulative count of Article Views (full-text article views including HTML views, PDF and ePub downloads, according to the available data) and Abstracts Views on Vision4Press platform.
Data correspond to usage on the plateform after 2015. The current usage metrics is available 48-96 hours after online publication and is updated daily on week days.
Initial download of the metrics may take a while.