Open Access
Fig. 5.
Download original image
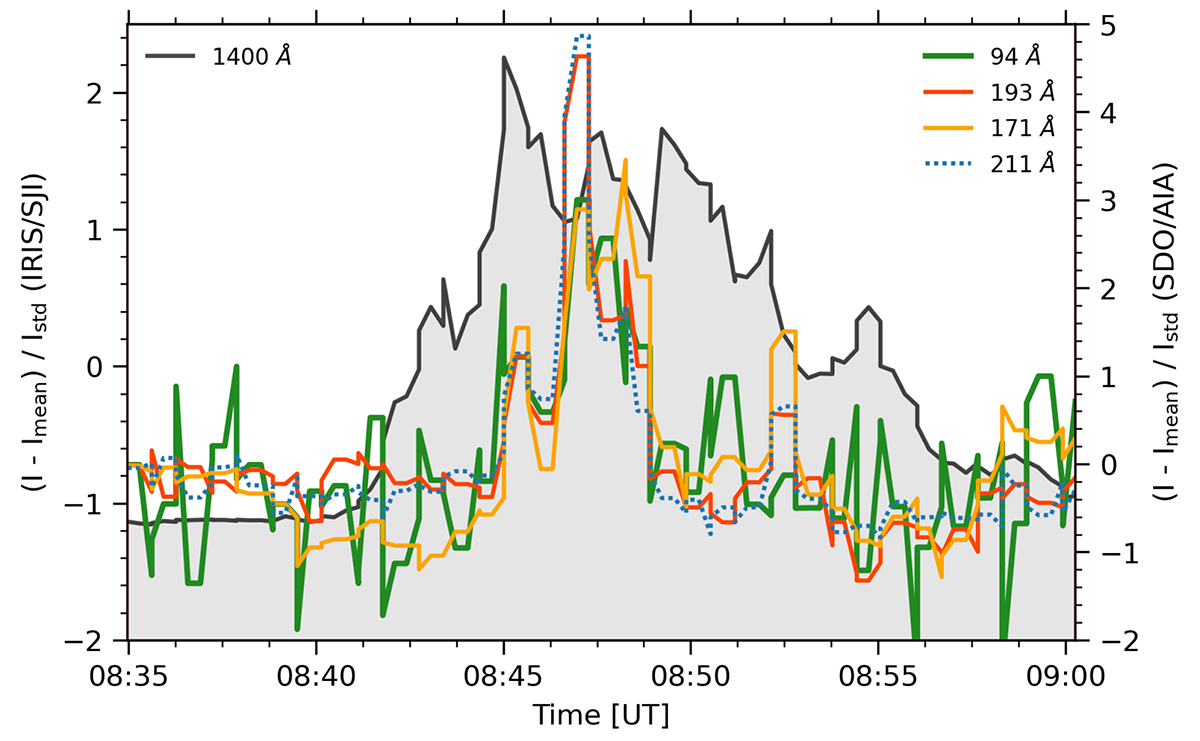
Standardized intensity calculated within the light gray rectangle shown in Fig. 1. The curve from IRIS (left axis) shows the UV burst in SJI 1400 Å (black), whereas the curves from SDO (right axis) depict its EUV counterpart in the AIA filters 94 Å (green), 193 Å (red), 171 Å (yellow), and 211 Å (blue).
Current usage metrics show cumulative count of Article Views (full-text article views including HTML views, PDF and ePub downloads, according to the available data) and Abstracts Views on Vision4Press platform.
Data correspond to usage on the plateform after 2015. The current usage metrics is available 48-96 hours after online publication and is updated daily on week days.
Initial download of the metrics may take a while.