Fig. 4.
Download original image
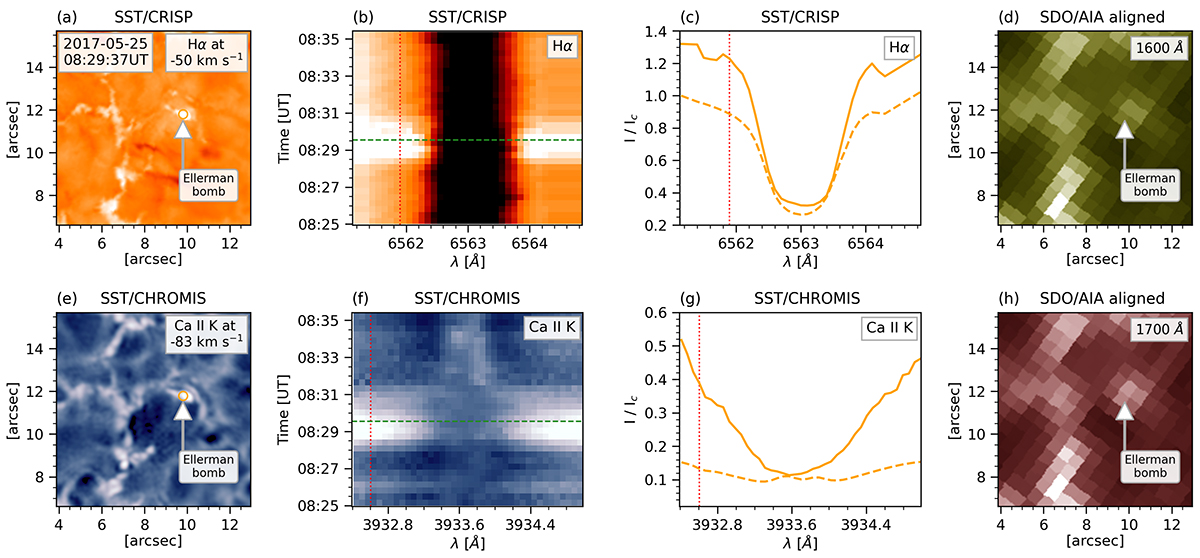
Ellerman Bomb. Panels (a) and (e): Maps of the Hα and Ca II K lines, respectively, in the far-blue wing. The location of the EB centered at (9.″8, 11.″8) is indicated with a circle. Panels (b) and (f): λ − t plot at the center of the EB for Hα and Ca II K, respectively. The vertical red line indicates the spectral position shown in panels (a) and (e), while the horizontal green line indicates the time. Panels (c) and (g): Comparison between the spectral profile of the EB (solid) and the average profile over the whole FOV of the observation (dashed) for Hα and Ca II K, respectively. Panels (d) and (h): SDO/AIA 1600 and 1700 Å channels aligned to SST. An animation of this figure is available online showing the time evolution from 08:25 to 08:35 UT.
Current usage metrics show cumulative count of Article Views (full-text article views including HTML views, PDF and ePub downloads, according to the available data) and Abstracts Views on Vision4Press platform.
Data correspond to usage on the plateform after 2015. The current usage metrics is available 48-96 hours after online publication and is updated daily on week days.
Initial download of the metrics may take a while.