Fig. 3.
Download original image
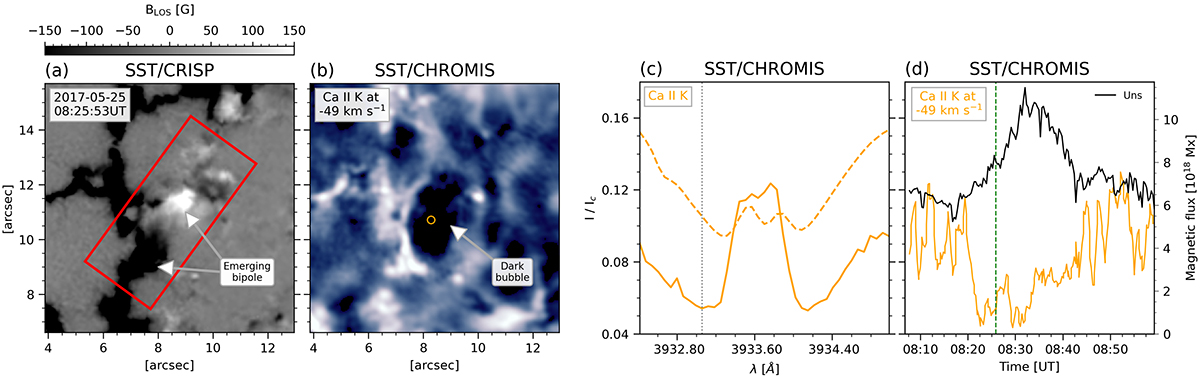
Dark bubble. Panel (a): LOS magnetogram from SST/CRISP. Panel (b): Ca II K map at −49 km s−1 from SST/CHROMIS. Panel (c): Ca II K profiles normalized to the continuum for the location marked in panel (b) (solid line), and the average over the whole FOV of the observation (dashed line). Panel (d): Time evolution of the normalized Ca II K intensity at −49 km s−1 for the position indicated in panel (b) (orange), and the unsigned magnetic flux from SST/CRISP within the red rectangle (black). An animation of this figure is available online showing the time evolution from 08:07 to 08:59 UT.
Current usage metrics show cumulative count of Article Views (full-text article views including HTML views, PDF and ePub downloads, according to the available data) and Abstracts Views on Vision4Press platform.
Data correspond to usage on the plateform after 2015. The current usage metrics is available 48-96 hours after online publication and is updated daily on week days.
Initial download of the metrics may take a while.