Fig. 1.
Download original image
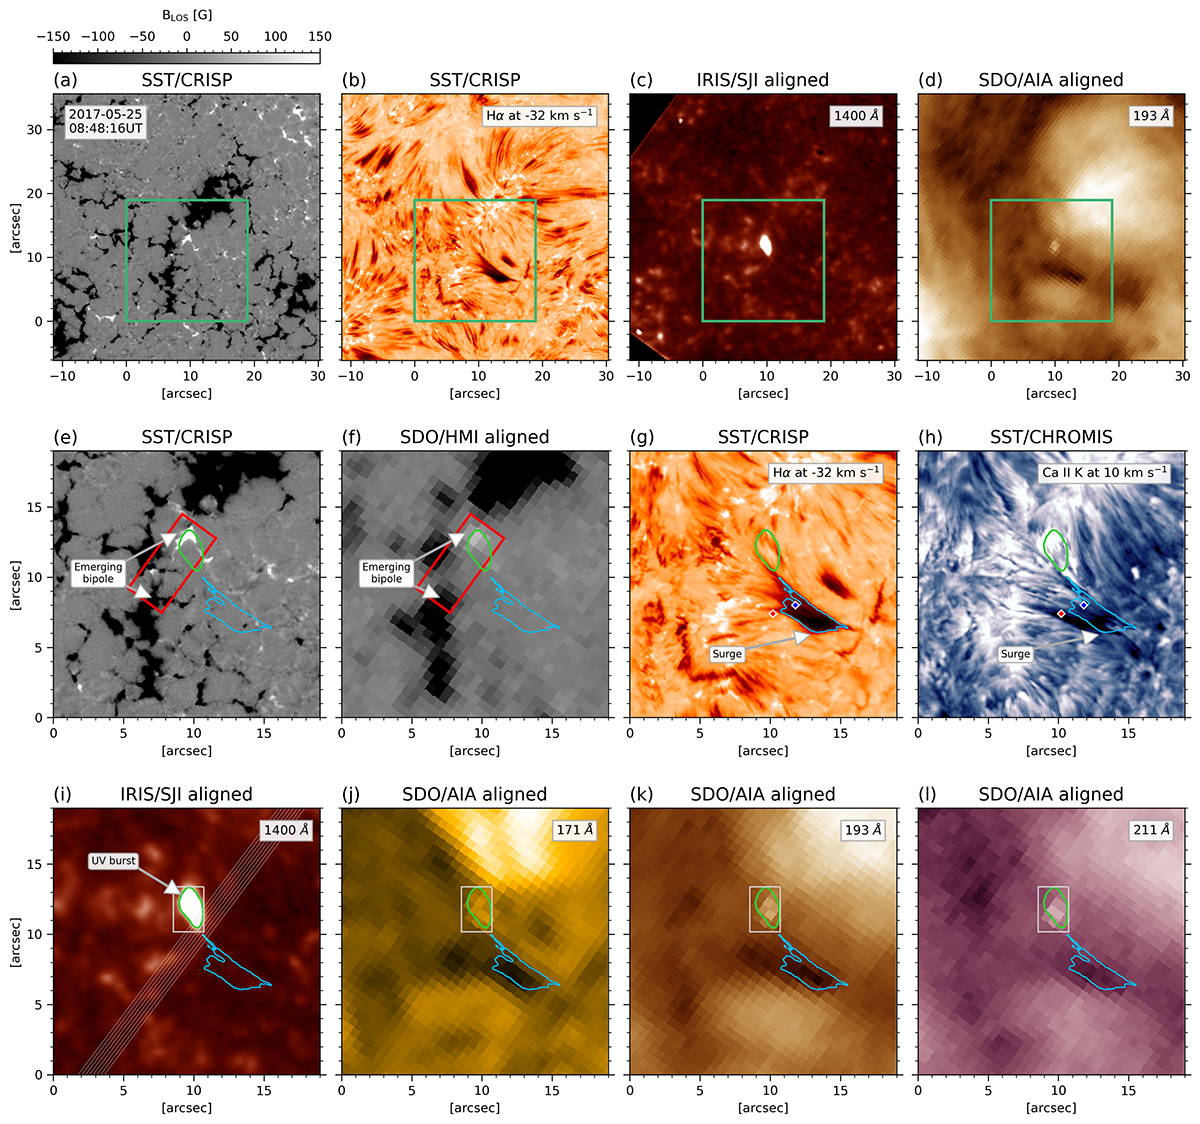
Coordinated observations on 2017 May 25 at ∼08:48 UT. Panel (a): LOS magnetogram for SST/CRISP. Panel (b): Hα at −32 km s−1 from SST/CRISP. Panel (c): IRIS/SJI 1400 Å aligned to SST. Panel (d): SDO/AIA 193 Å aligned to SST. The 19″ × 19″ field of view highlighted in green encompasses the region of interest shown in the rest of the panels. Panels (e) and (f): LOS magnetograms for SST/CRISP and SDO/HMI aligned to SST, respectively. The red rectangle delimits the area where magnetic flux is analyzed in Sect. 3.1. Panel (g): Hα at −32 km s−1 from SST/CRISP. The colored diamonds indicate the location of the spectral profiles shown in Sect. 3.5. Panel (h): Ca II K at 10 km s−1 taken with SST/CHROMIS. Panel (i): IRIS/SJI 1400 Å with eight lines indicating the approximate locations of the spectrograph slit and the area covered by the raster scan. The light curves within the light gray rectangle are studied in Sect. 3.4. Panels (j), (k), and (l): SDO/AIA 171 Å, 193 Å, and 211 Å, respectively. In all the zoomed-in panels, the colored contours delimit the surge in the Hα blue wing (blue) and the UV burst on the IRIS/SJI 1400 (green). An animation of this figure is available online with the evolution of the system from 08:15 to 09:02 UT.
Current usage metrics show cumulative count of Article Views (full-text article views including HTML views, PDF and ePub downloads, according to the available data) and Abstracts Views on Vision4Press platform.
Data correspond to usage on the plateform after 2015. The current usage metrics is available 48-96 hours after online publication and is updated daily on week days.
Initial download of the metrics may take a while.