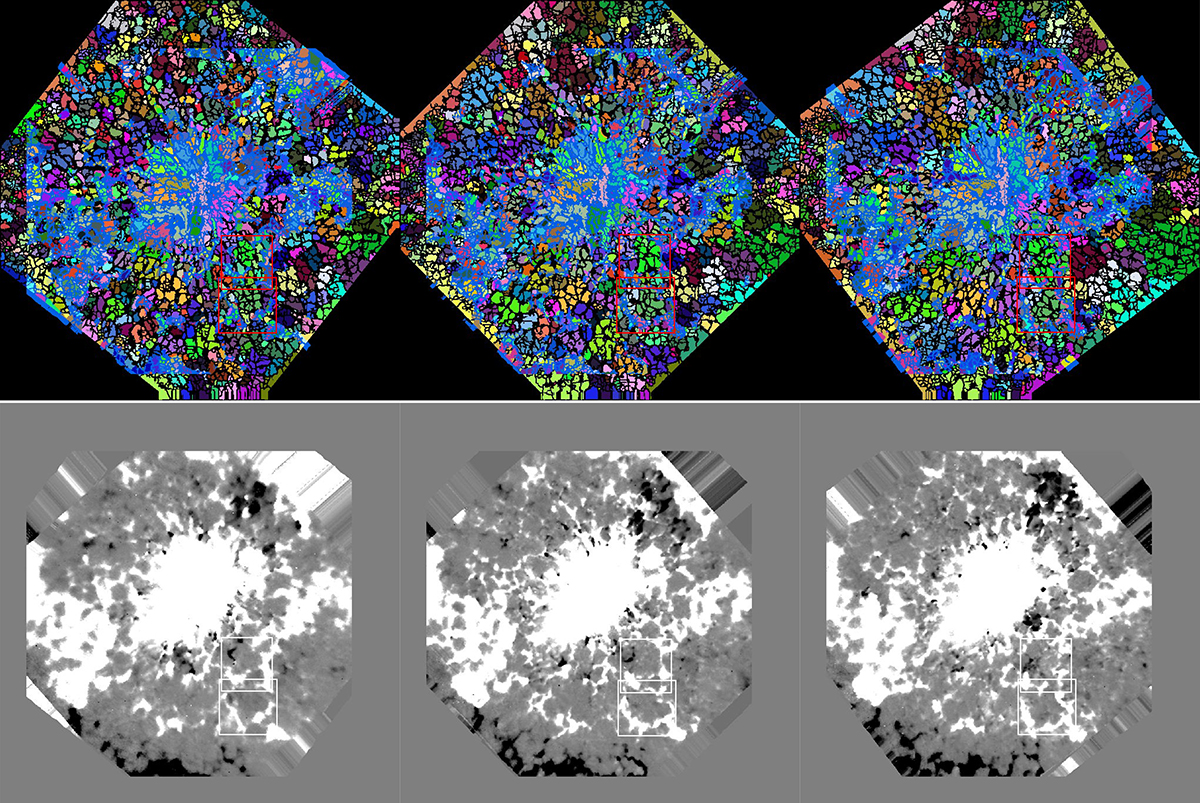
Fig. 9.
Download original image
TFG evolution at three different times (top) following the granules with the horizontal flows after t = 1427 s (at 16:58:59 UT), after t = 3214 s (at 17:28:48 UT), and after t = 5001 s (at 17:58:33 UT) and superimposed NIRIS magnetic field (blue). Bottom: Evolution of the magnetic field (now in white). The magnetic field has been reversed for a better view of the MMFs. The two squares locate the TFG1 and TFG2 examples shown in more detail in Figs. 10 and 11. The FoV is 70″ × 70″ and the threshold of the magnetic field is 20 Gauss. The black or white lines in the diagonal are artifacts due to field rotation. Animation of the magnetic field in blue is provided in online movie Intb-paper.mp4.
Current usage metrics show cumulative count of Article Views (full-text article views including HTML views, PDF and ePub downloads, according to the available data) and Abstracts Views on Vision4Press platform.
Data correspond to usage on the plateform after 2015. The current usage metrics is available 48-96 hours after online publication and is updated daily on week days.
Initial download of the metrics may take a while.