Fig. 5.
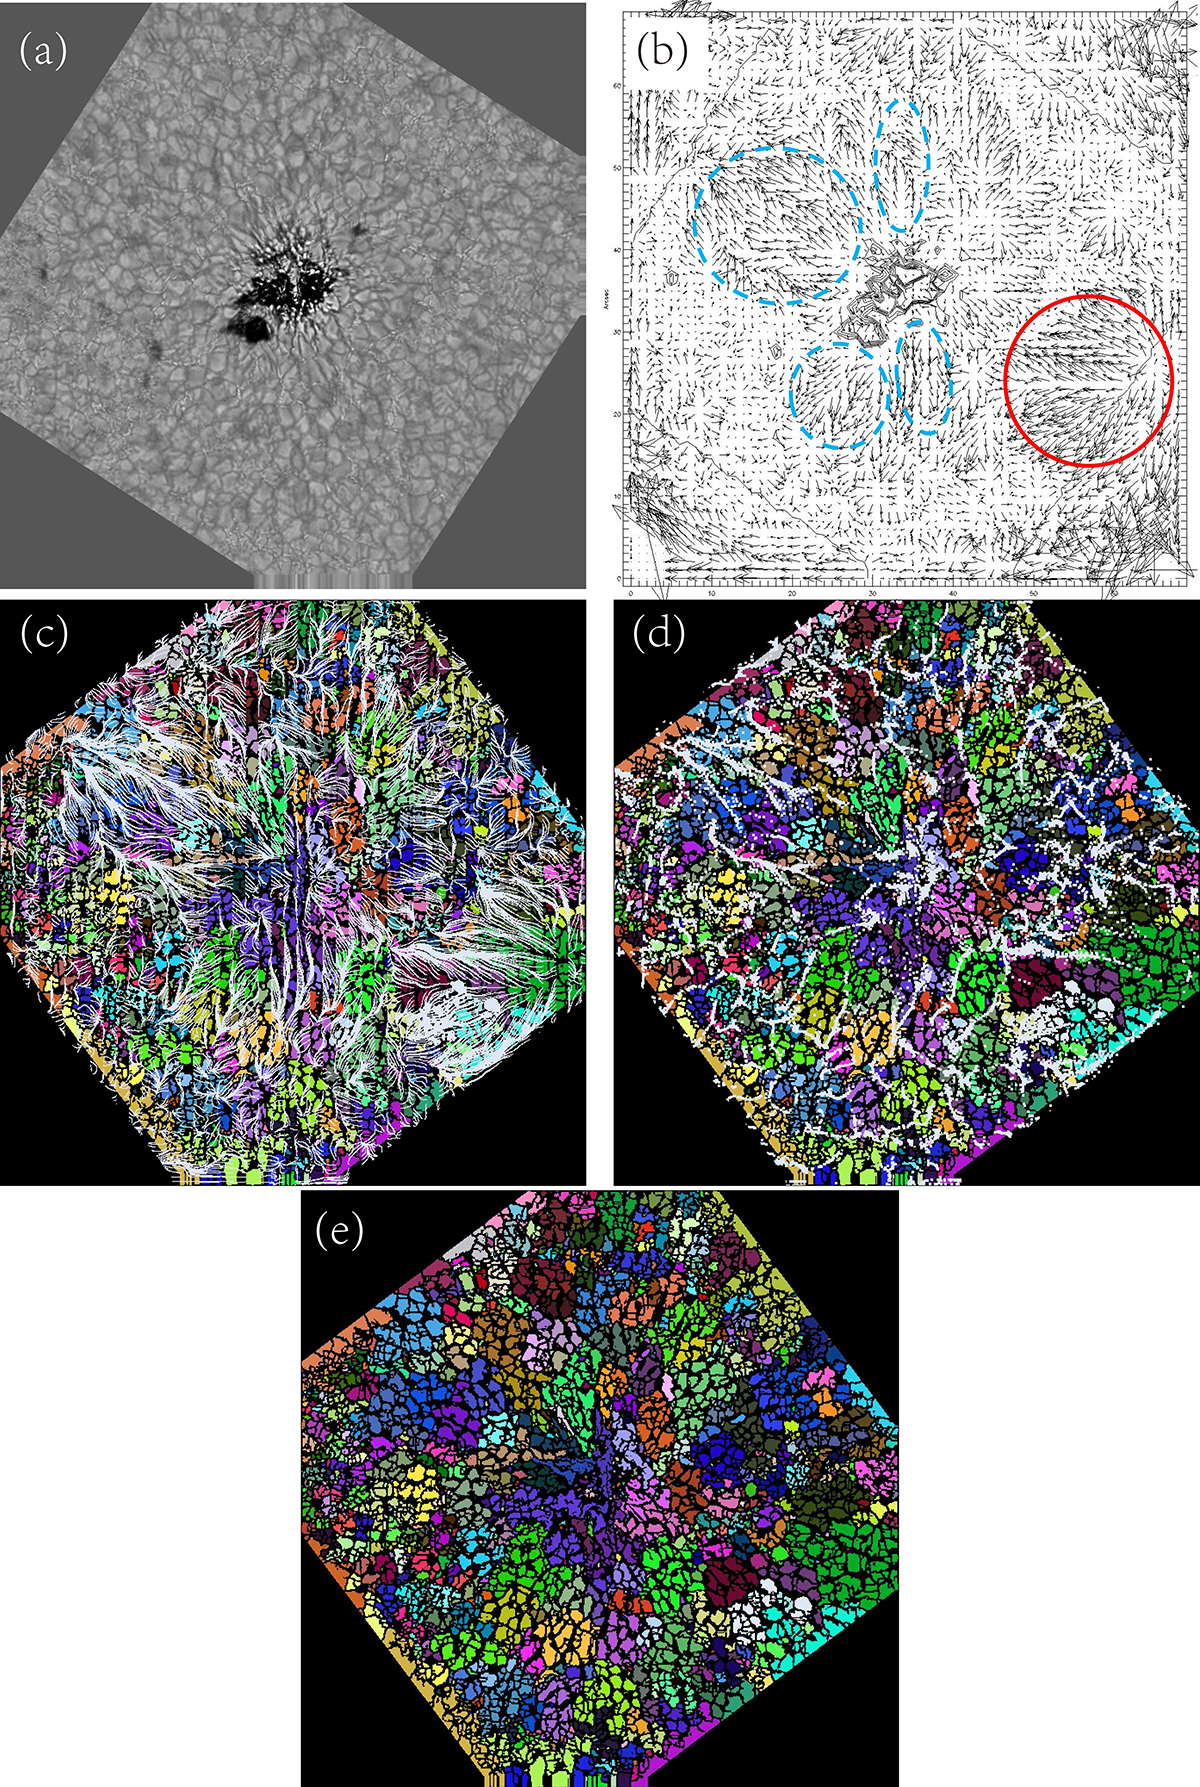
Download original image
Zoom on the leading spot of AR 12579 observed with GST in TiO in panel a. Panel b shows the horizontal velocities averaged over all the time sequence. The amplitude is between 0 and 2 km s−1. The contour of the sunspot umbra (black line) is visible in the center of the image. An example of supergranule flow is surrounded by the red line. Blue dashed line contours show high radial moat flows going away from the sunspot. Panel c: TFGs (or families of granules) obtained with the horizontal velocies after 5001 s (at 17:58:33 UT) overlapped by cork trajectories, each TFG has a specific color (blue, red, green...). Panel d: same TFG map at the same time overlapped by the cork location. Panel e: map of the TFGs alone at 17:58:33 UT in the different colors. We note that the cork locations are dispersed toward the edges of the TFGs. The field of view is 70″ × 70″.
Current usage metrics show cumulative count of Article Views (full-text article views including HTML views, PDF and ePub downloads, according to the available data) and Abstracts Views on Vision4Press platform.
Data correspond to usage on the plateform after 2015. The current usage metrics is available 48-96 hours after online publication and is updated daily on week days.
Initial download of the metrics may take a while.