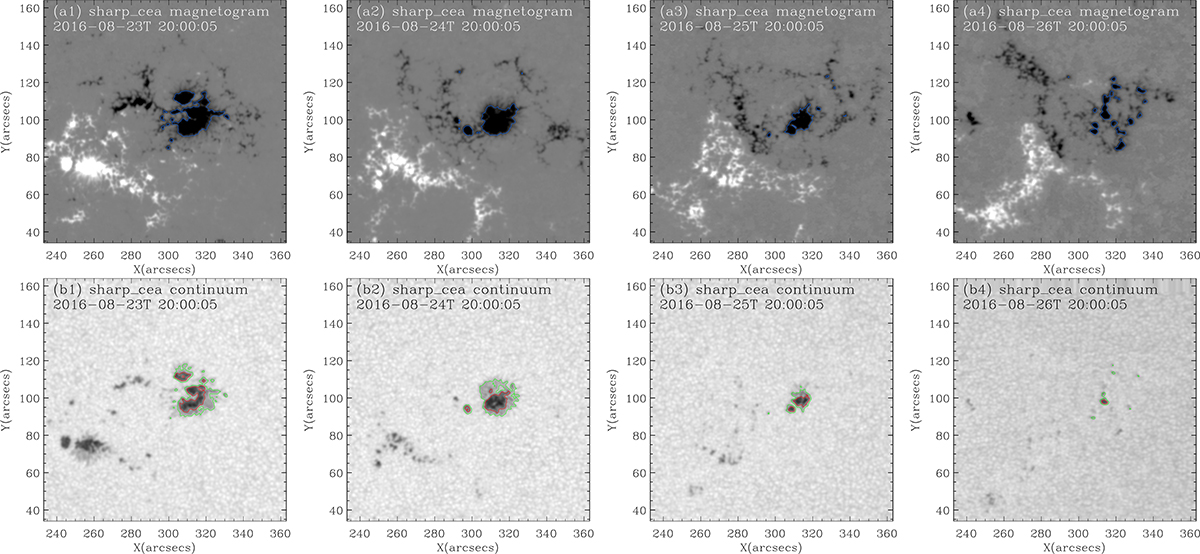
Fig. 2.
Download original image
Temporal evolution of the active region NOAA 12579 observed with the SDO/HMI between August 23 and August 26, 2016. Top panels: magnetograms, with the blue contour lines representing the magnetic field boundary of −600 G. Bottom panels: continuum images, with the red, and green contour lines corresponding to umbra and penumbra values of 0.7 I0 and 0.87 I0, respectively.
Current usage metrics show cumulative count of Article Views (full-text article views including HTML views, PDF and ePub downloads, according to the available data) and Abstracts Views on Vision4Press platform.
Data correspond to usage on the plateform after 2015. The current usage metrics is available 48-96 hours after online publication and is updated daily on week days.
Initial download of the metrics may take a while.