Fig. 10.
Download original image
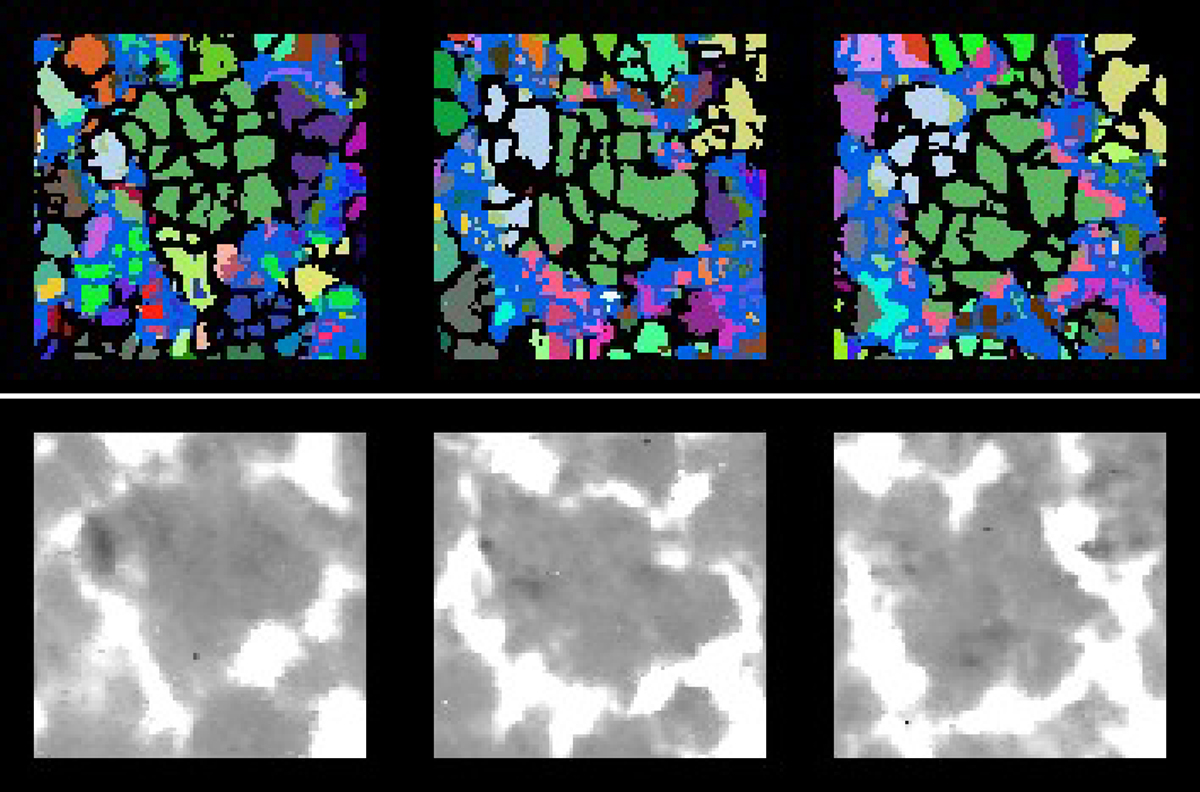
Zoom on TFG 1 (green color) evolution at three different times (top) following the granules with the horizontal flows after t = 1427 s (at 16:58:59 UT), after t = 3214 s (at 17:28:48 UT), and after t = 5001 s (at 17:58:33 UT) superimposed NIRIS magnetic field (blue). Bottom: evolution of the magnetic field network (now in white) showing the global motion of the network. For example the round shape network cell is approaching the bottom of the image due to the “displacement” of TFG1 towards the bottom. The magnetic field has been reversed for a better view of the MMFs. The FoV is 9.9″ × 9.7″.
Current usage metrics show cumulative count of Article Views (full-text article views including HTML views, PDF and ePub downloads, according to the available data) and Abstracts Views on Vision4Press platform.
Data correspond to usage on the plateform after 2015. The current usage metrics is available 48-96 hours after online publication and is updated daily on week days.
Initial download of the metrics may take a while.