Open Access
Fig. 1.
Download original image
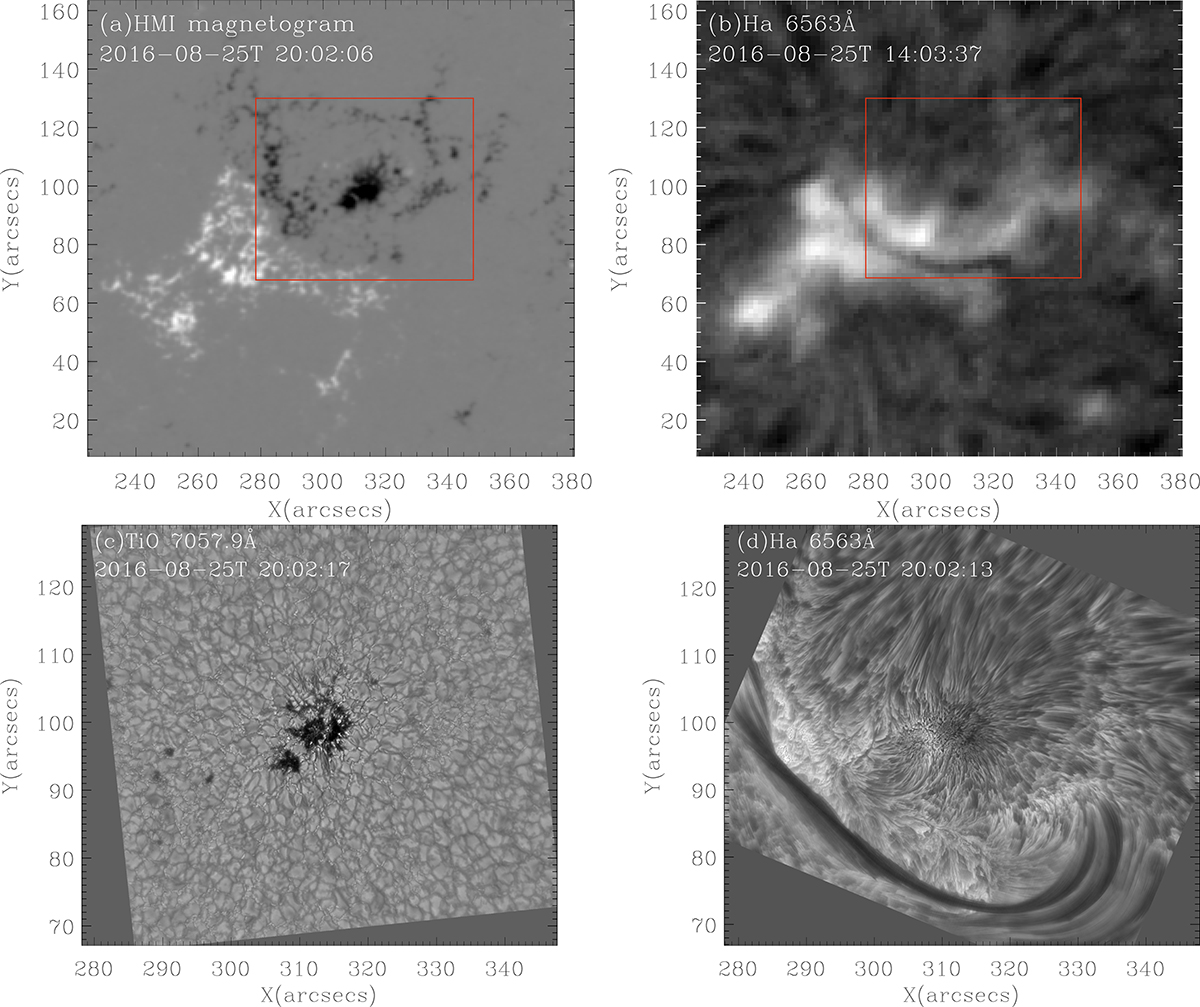
Active region NOAA 12579 on August 25 2016: HMI magnetogram (panel a). Hα image (Bass2000 survey, panel b). GST images of the leading sunspot in TiO (panel c), in Hα (panel d). The red boxes in panel a and panel b have the same FoV, corresponding to the FoV of panel c and panel d.
Current usage metrics show cumulative count of Article Views (full-text article views including HTML views, PDF and ePub downloads, according to the available data) and Abstracts Views on Vision4Press platform.
Data correspond to usage on the plateform after 2015. The current usage metrics is available 48-96 hours after online publication and is updated daily on week days.
Initial download of the metrics may take a while.