Fig. 6.
Download original image
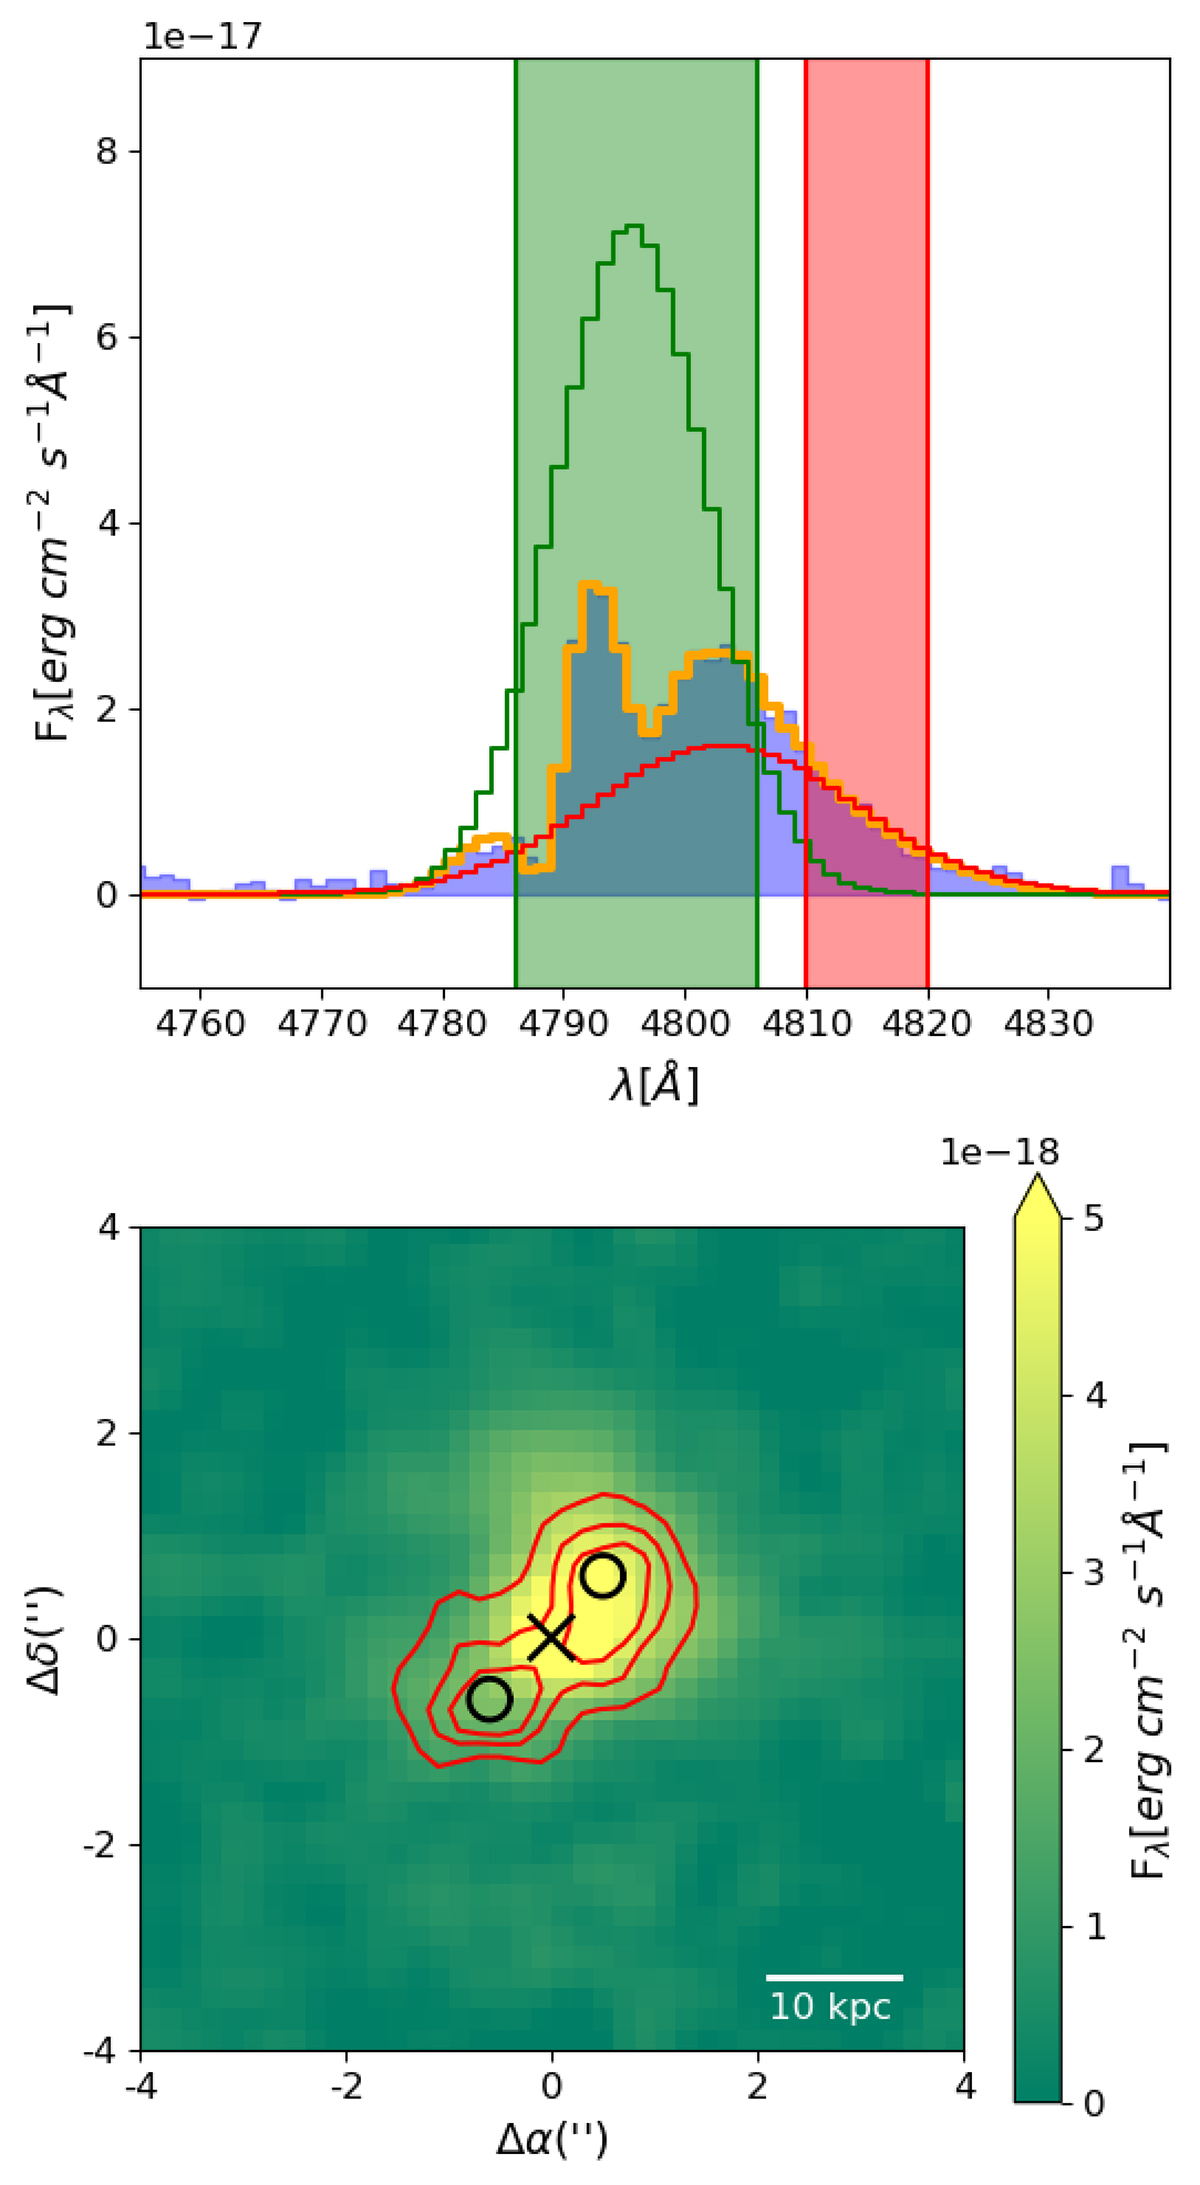
Top: Total spectrum extracted by summing all the Voronoi bins (shaded blue histogram) and the toal model, extracted in the same manner (shown in the orange histogram). The total emission modeled for the main and red components are shown in the green and red histograms. The green and red shaded areas correspond to the selected bands used for the extraction of the flux maps. Bottom: Color map of the Lyα narrowband image extracted using a 20 Å wide band positioned on the approximate centroid of the Lyα emission. The black cross marks the brightest pixel in Lyα, which we assume coincides with the AGN position. The black circles mark the bright spots on each side of the red component. Shown in contours is the flux of the red tail from the Lyα profile, extracted using a 10 Å band. The contour levels are set at 0.5, 0.8 and 1 × 10⁻¹⁸ erg s−1 cm−2.
Current usage metrics show cumulative count of Article Views (full-text article views including HTML views, PDF and ePub downloads, according to the available data) and Abstracts Views on Vision4Press platform.
Data correspond to usage on the plateform after 2015. The current usage metrics is available 48-96 hours after online publication and is updated daily on week days.
Initial download of the metrics may take a while.