Fig. 4.
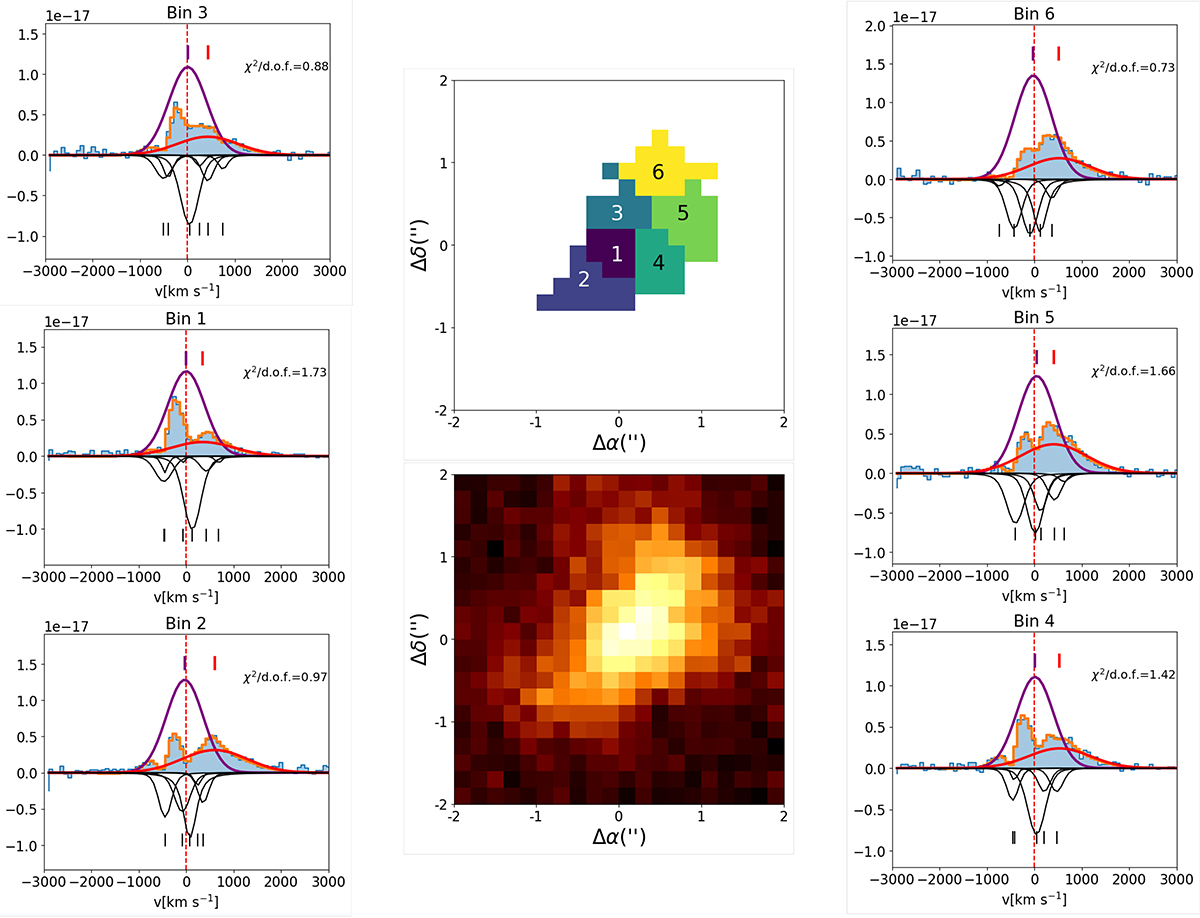
Download original image
Profile analysis of the Lyα nebula of TXS 0952−217. Center top: Pixels selected for the analysis based on an S/N > 1.5 threshold, divided into the optimized Voronoi bins. Inside each bin is included an identifying number, which is referenced in the spectrum title. Center bottom: Narrowband image from which the pixels were selected. Left and right: Individual spectra in the Voronoi bins, identified by the bin number atop each plot. The blue shaded histogram represents the observed flux, while the orange line represents the total model, combining emission and absorption. Each individual component is also overlaid, in purple and red for the emission and in black for the absorption. The purple and red tick marks at the top correspond to the central velocities of each emission component, while the black tick marks at the bottom are their equivalents in absorption. All fluxes are given in erg cm−2 s−1 Å−1.
Current usage metrics show cumulative count of Article Views (full-text article views including HTML views, PDF and ePub downloads, according to the available data) and Abstracts Views on Vision4Press platform.
Data correspond to usage on the plateform after 2015. The current usage metrics is available 48-96 hours after online publication and is updated daily on week days.
Initial download of the metrics may take a while.