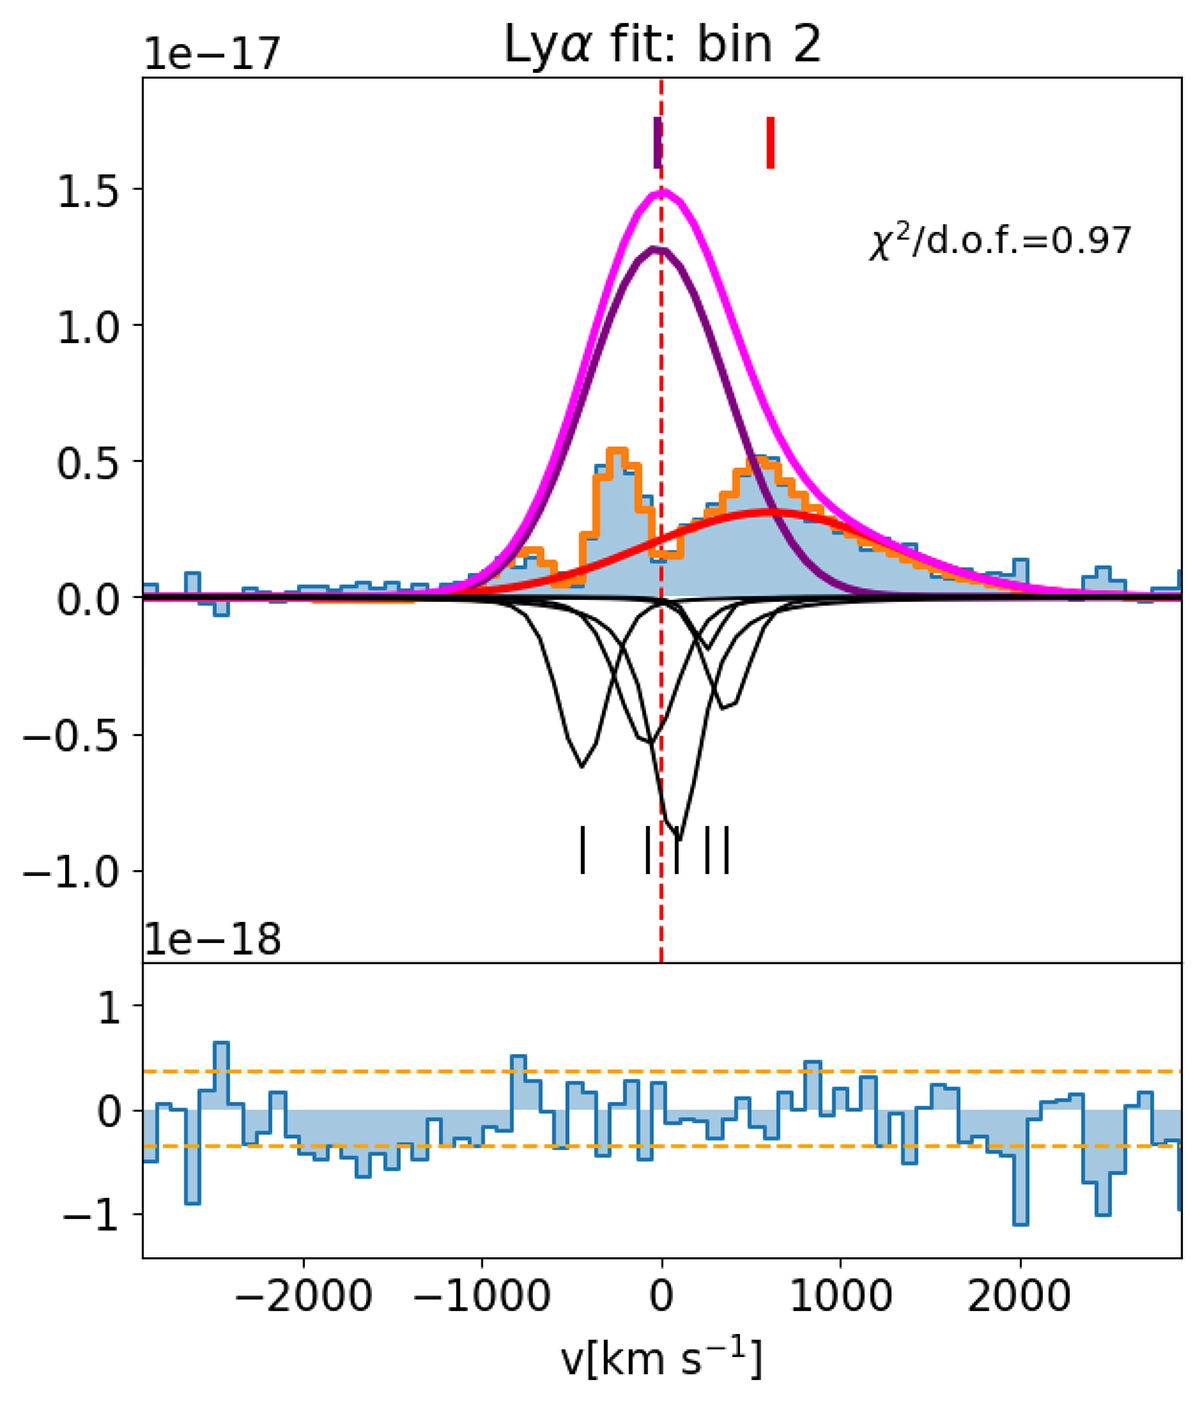
Fig. 3.
Download original image
Top: Example spectrum extracted from one of the selected Voronoi bins. The blue shaded histogram represents the observed flux. Shown in purple is the main Lyα component, in red the redshifted emission, in magenta the total combined emission and in black the absorption components. The vertical red and purple markings denote the emission component centroids. The orange histogram represents the total model, combining emission and absorption. Bottom: Fit residuals presented in the blue shaded histogram. The horizontal dashed orange lines represent the noise thresholds.
Current usage metrics show cumulative count of Article Views (full-text article views including HTML views, PDF and ePub downloads, according to the available data) and Abstracts Views on Vision4Press platform.
Data correspond to usage on the plateform after 2015. The current usage metrics is available 48-96 hours after online publication and is updated daily on week days.
Initial download of the metrics may take a while.