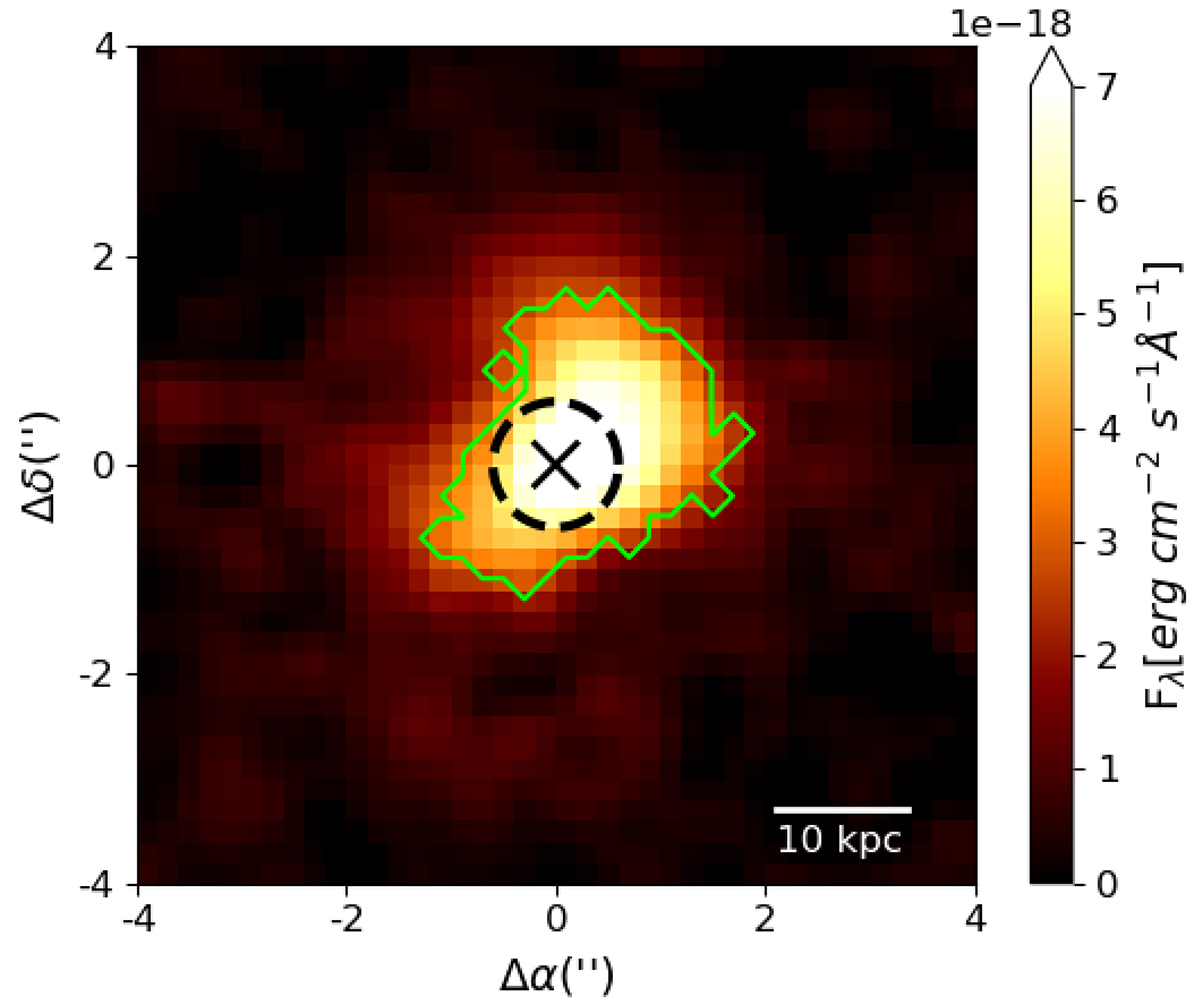
Fig. 2.
Download original image
Lyα narrowband image extracted using a 25 Å wide band centered on the approximate centroid of the Lyα emission. The cross represents the brightest pixel, which is the assumed AGN position, and corresponds to the Δα = 0″, Δδ = 0″ position. The dashed circle represents the upper limit on the size of the radio emission under the same assumption of AGN position. The green contours represent the 2σ detection limits. The image has been smoothed with a Gaussian 2D kernel.
Current usage metrics show cumulative count of Article Views (full-text article views including HTML views, PDF and ePub downloads, according to the available data) and Abstracts Views on Vision4Press platform.
Data correspond to usage on the plateform after 2015. The current usage metrics is available 48-96 hours after online publication and is updated daily on week days.
Initial download of the metrics may take a while.