Fig. 1.
Download original image
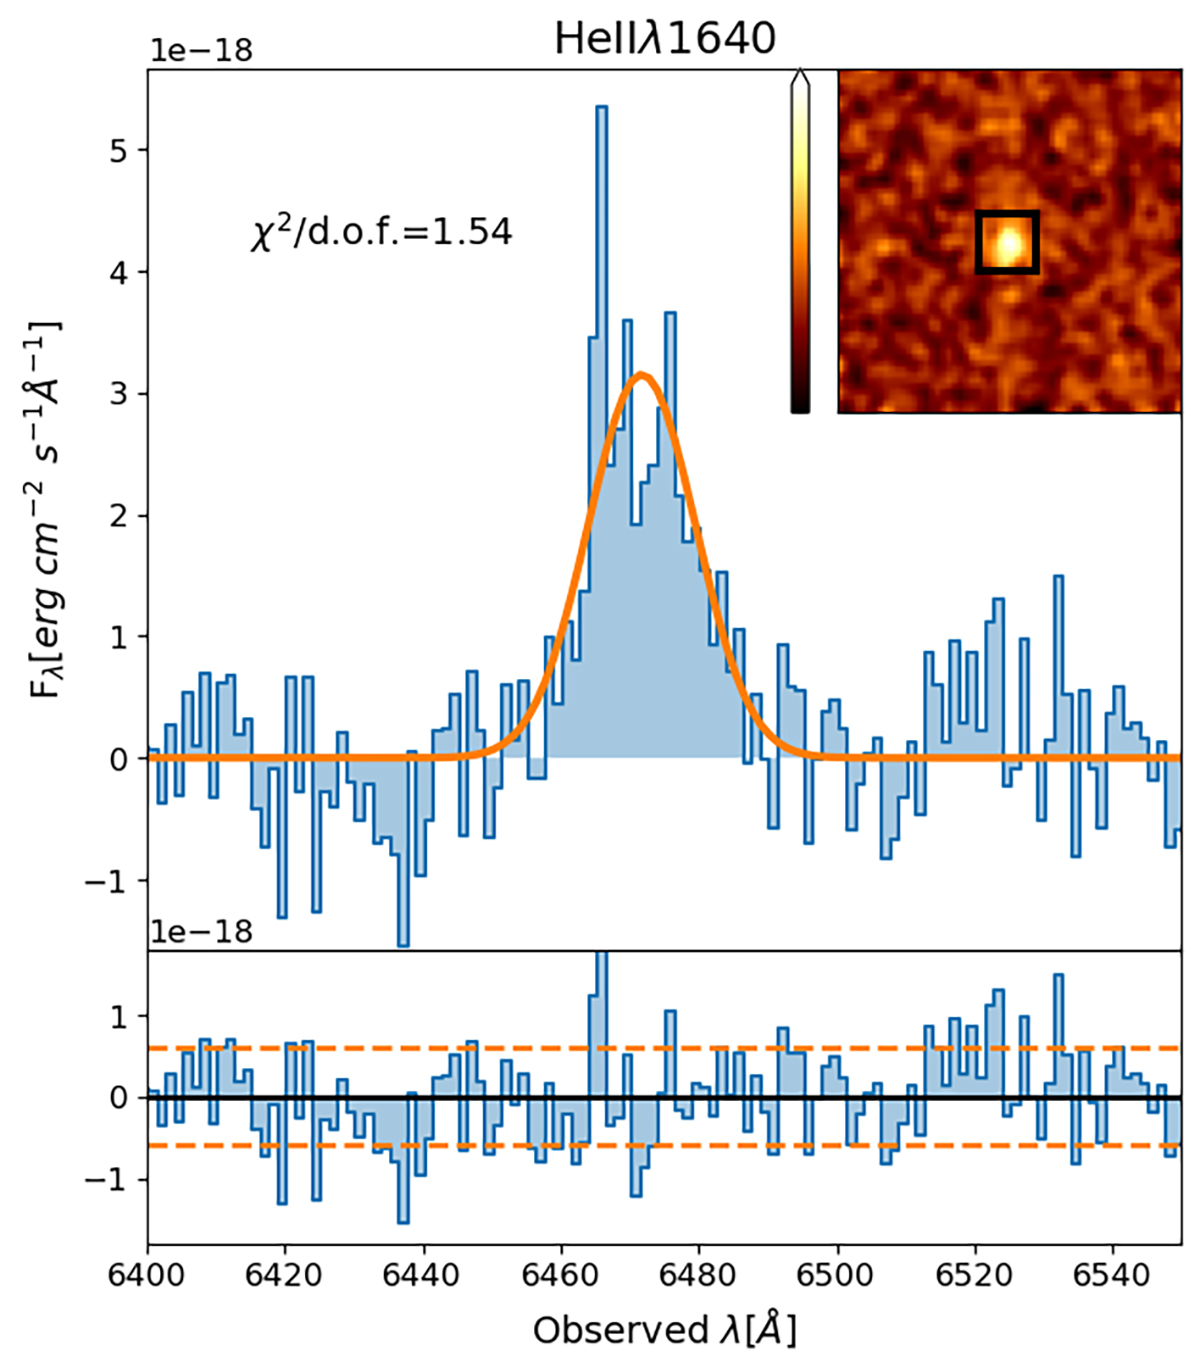
Top: Continuum-subtracted HeIIλ1640 emission line profile extracted from a ![]() rectangular aperture centered on the emission peak. The position of the aperture relative to the HeII emission, extracted using a 20 Å wide band is displayed in the top right inset. The orange line corresponds to the modeled emission profile. Bottom: Residuals from the fit, with the dashed orange lines marking the measured noise level.
rectangular aperture centered on the emission peak. The position of the aperture relative to the HeII emission, extracted using a 20 Å wide band is displayed in the top right inset. The orange line corresponds to the modeled emission profile. Bottom: Residuals from the fit, with the dashed orange lines marking the measured noise level.
Current usage metrics show cumulative count of Article Views (full-text article views including HTML views, PDF and ePub downloads, according to the available data) and Abstracts Views on Vision4Press platform.
Data correspond to usage on the plateform after 2015. The current usage metrics is available 48-96 hours after online publication and is updated daily on week days.
Initial download of the metrics may take a while.