Fig. 22
Download original image
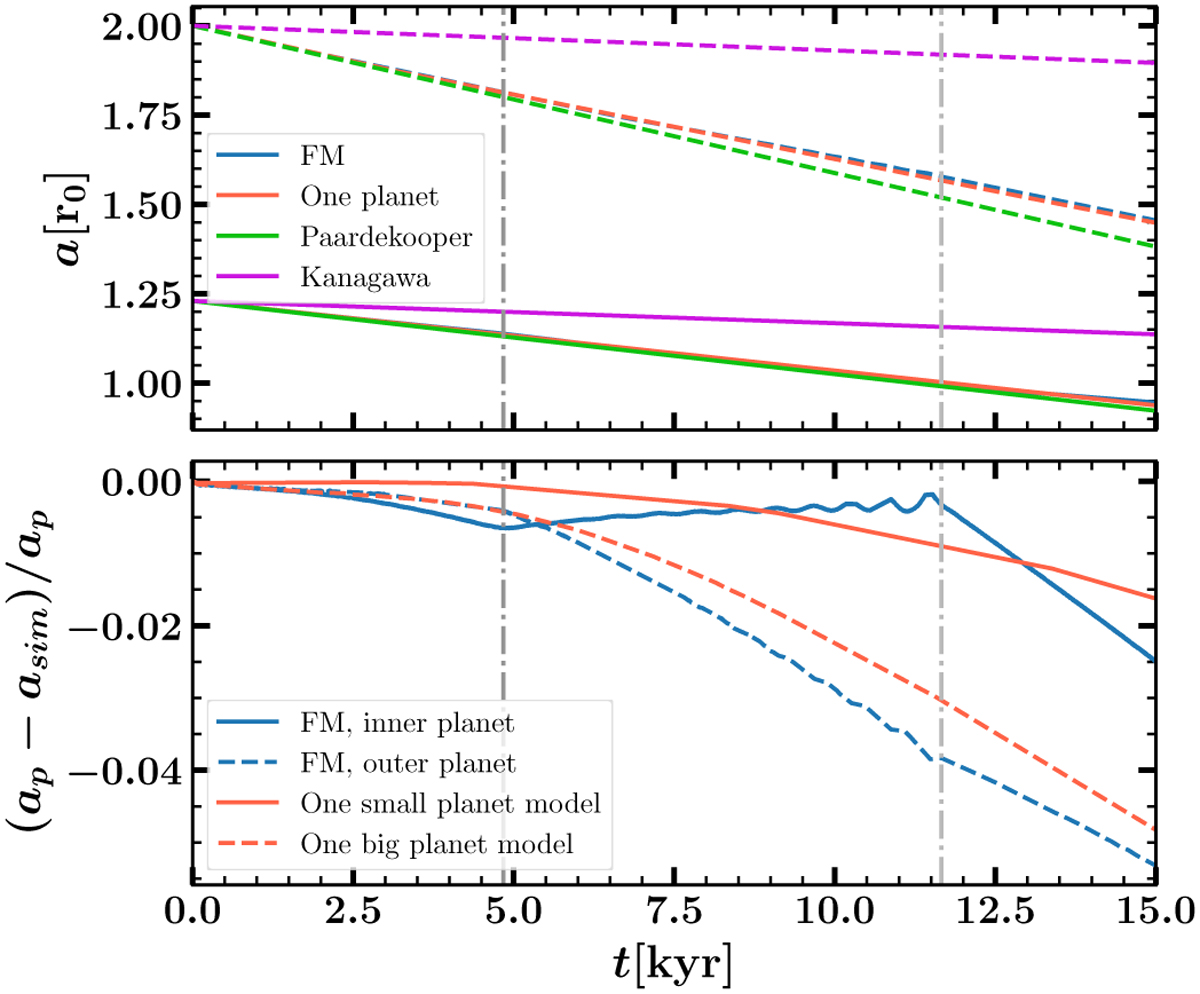
Comparison of semi-major axes obtained through simulation with different theoretical models. Top: orbital evolution of our FM, along with two semi-theoretical models from Paardekooper et al. (2010, without a gap opening) and Kanagawa et al. (2018, with a gap opening), alongside two additional simulations using the same disc properties as the FM but focussing on individual planets. Solid lines represent the semi-major axis of the inner planet, while dashed lines represent the outer planet. Bottom: evolution of the quantity (ap – asim)/ap, where ap represents the semi-major axis according to pure type-I migration and asim denotes the semi-major axis of both the inner and outer planets in our FM, as well as the single small and big planets in our single-planet simulations. The period of resonance is indicated between the dark and light grey time intervals.
Current usage metrics show cumulative count of Article Views (full-text article views including HTML views, PDF and ePub downloads, according to the available data) and Abstracts Views on Vision4Press platform.
Data correspond to usage on the plateform after 2015. The current usage metrics is available 48-96 hours after online publication and is updated daily on week days.
Initial download of the metrics may take a while.