Fig. A.4.
Download original image
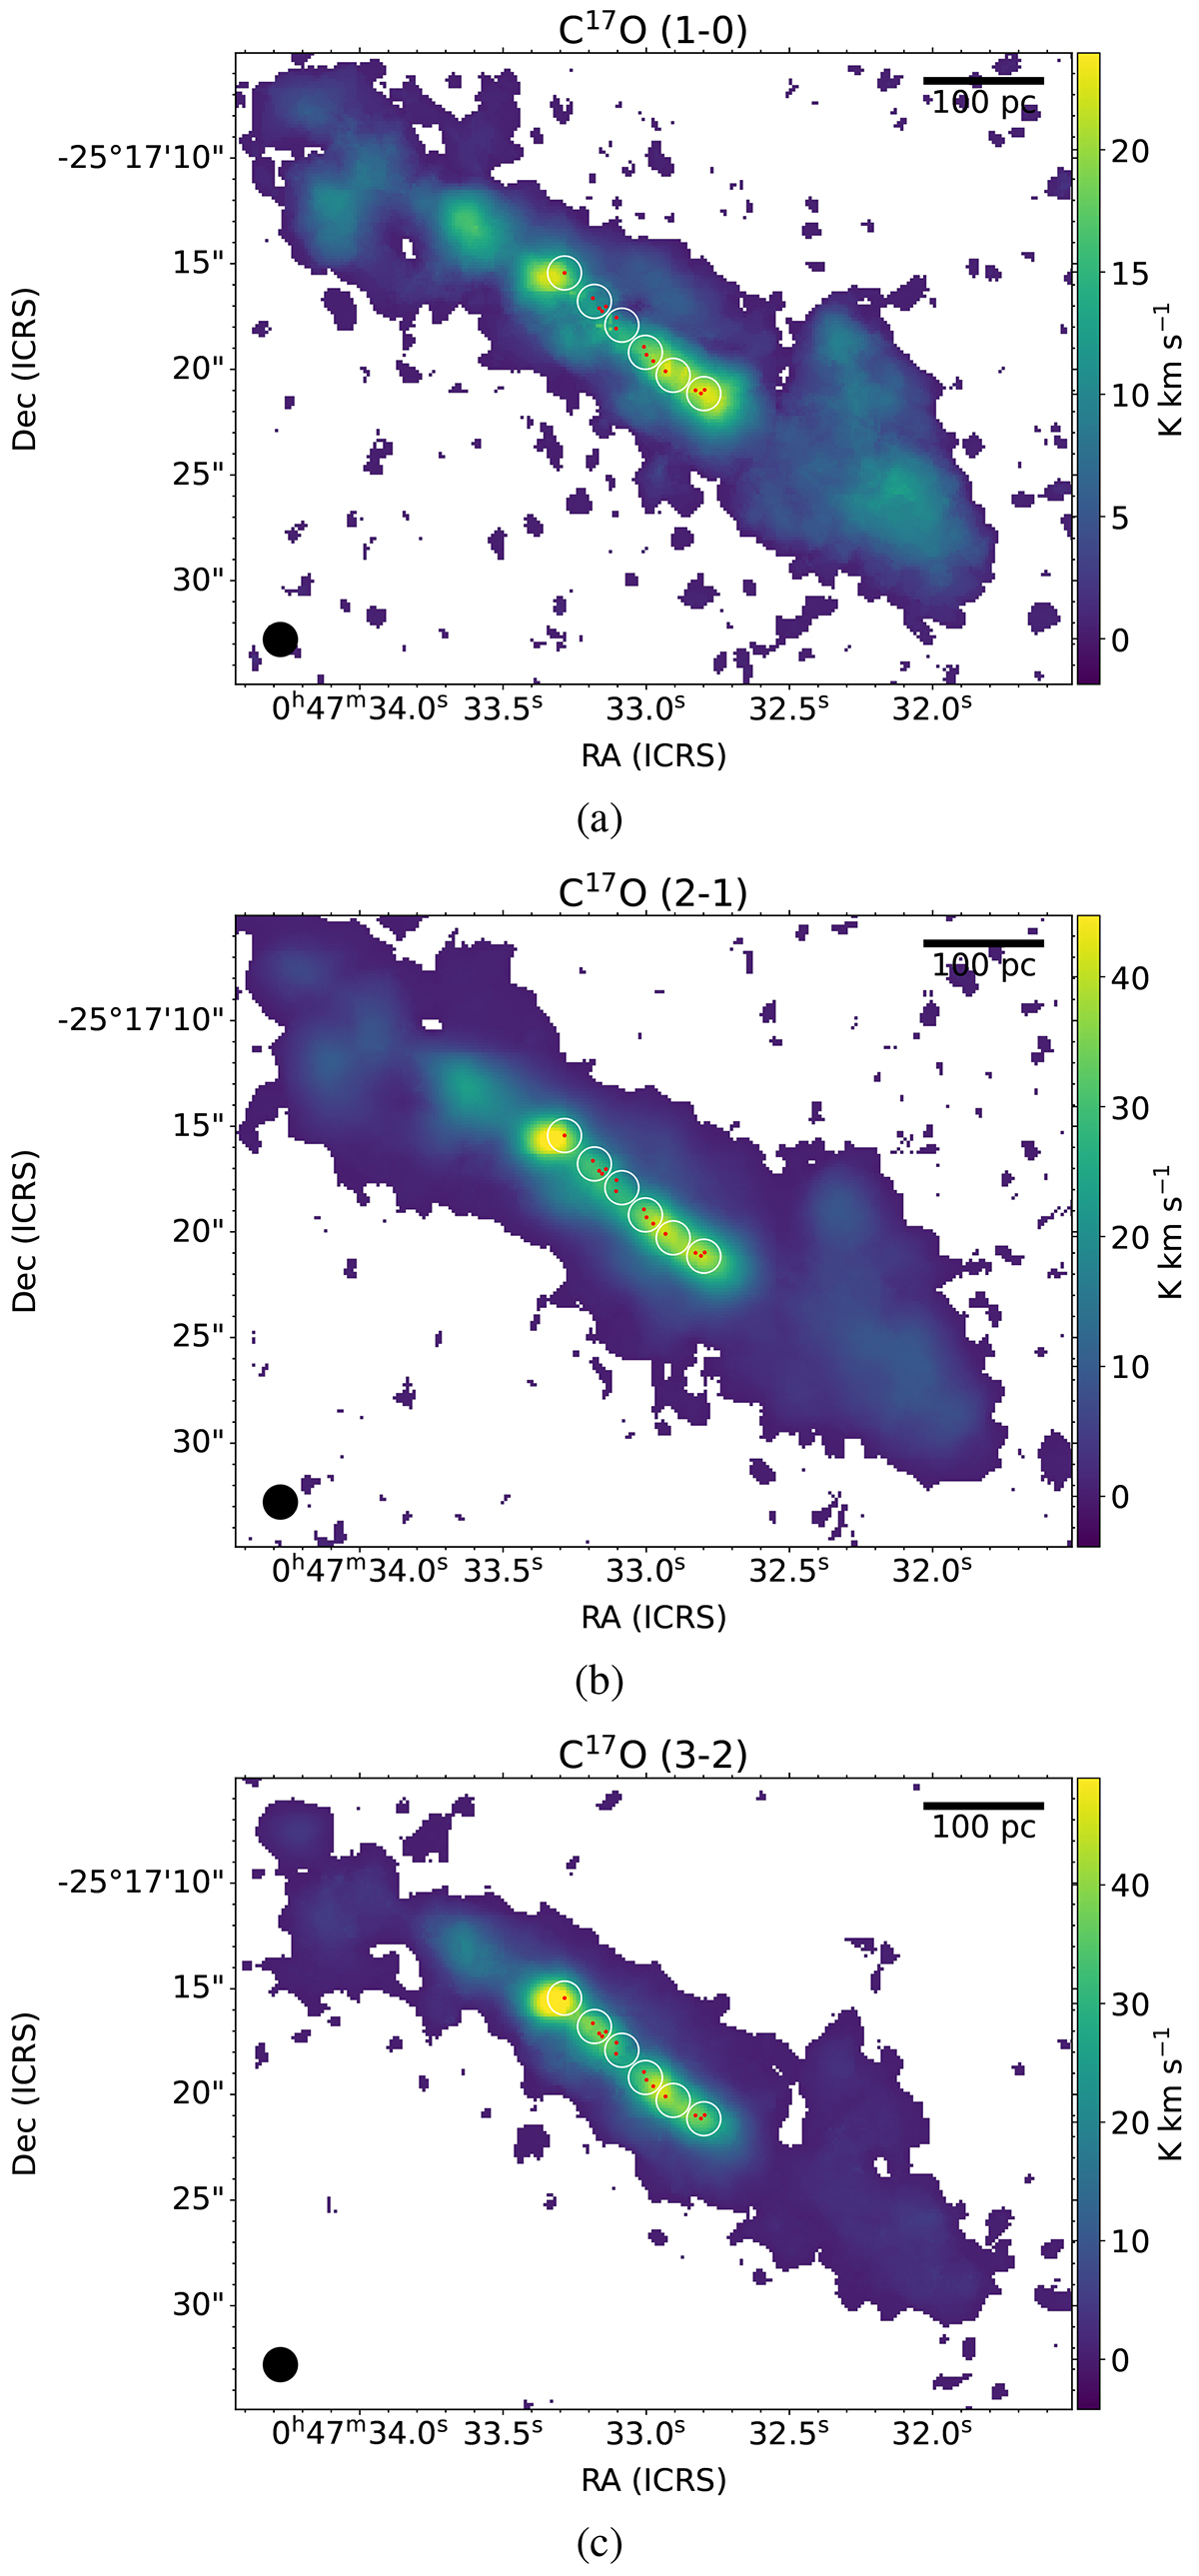
Velocity-integrated line intensities in [K km s−1] of C17O (1-0), (2-1) and (3-2). Each of the maps shown was generated using a signal-to-noise-ratio cutoff of 3. The studied SSC regions as listed in Table 4 are labelled in white text on the map. The original SSC locations with appropriate beam sizes from Leroy et al. (2018) are shown by the red regions. The ALCHEMI 1″.6 × 1″.6 beam is displayed in the lower-left corner of the map.
Current usage metrics show cumulative count of Article Views (full-text article views including HTML views, PDF and ePub downloads, according to the available data) and Abstracts Views on Vision4Press platform.
Data correspond to usage on the plateform after 2015. The current usage metrics is available 48-96 hours after online publication and is updated daily on week days.
Initial download of the metrics may take a while.