Fig. 6
Download original image
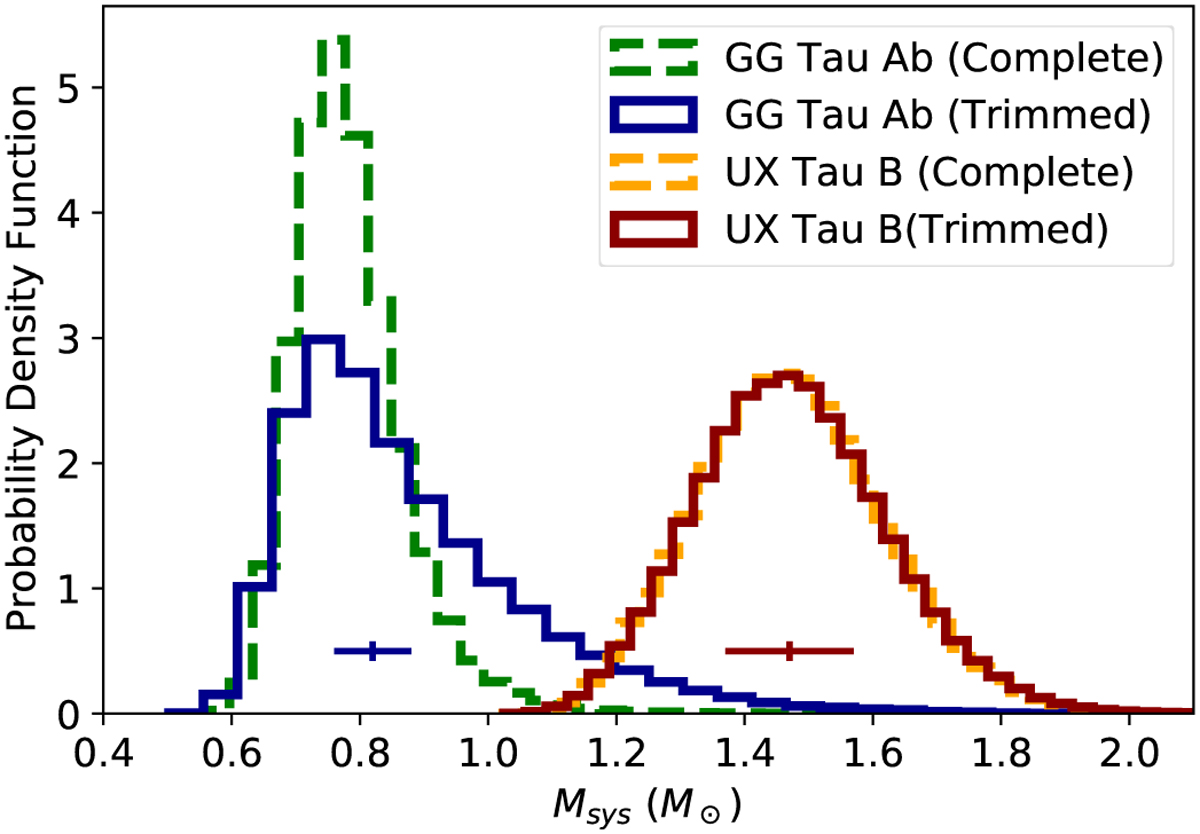
Posterior distribution for the dynamical mass of the GG Tau Ab and UX Tau B systems. In both cases, dashed and solid histograms represent the distributions using “complete” and “trimmed” astrometric datasets, respectively. The black horizontal bars represent the systematic error introduced by the uncertainty on the distance to each system.
Current usage metrics show cumulative count of Article Views (full-text article views including HTML views, PDF and ePub downloads, according to the available data) and Abstracts Views on Vision4Press platform.
Data correspond to usage on the plateform after 2015. The current usage metrics is available 48-96 hours after online publication and is updated daily on week days.
Initial download of the metrics may take a while.