Fig. 1
Download original image
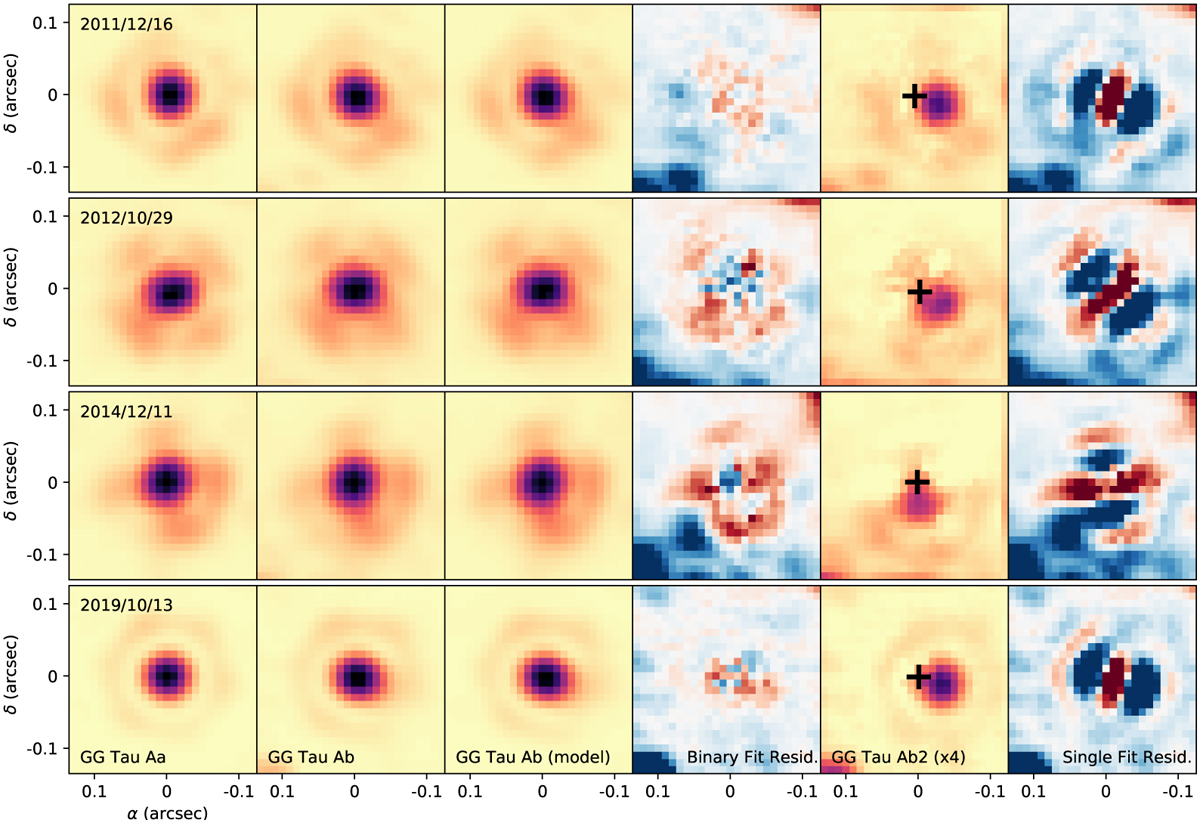
Thumbnails of Keck/NIRC2 images in the GG Tau system. The first and second columns represent GG Tau Aa and GG Tau Ab, normalized to their peak values, respectively. The third column is the best-fit model of GG Tau Ab created by shifting and scaling two copies of GG Tau Aa, and the fourth column is the residuals from this model. Red and blue regions are negative and positive residuals, respectively, with the color map saturating at ±3% of the peak pixel in the image of GG Tau Ab. The fifth column shows the result of subtracting the model of GG Tau Ab 1 (centered on the black cross) from the image of GG Tau Ab, revealing GG Tau Ab2, which is scaled up by a factor of four for visual purposes. The last column shows the residuals of fitting GG Tau Ab as a single star instead; they are displayed with the same saturation levels as in the fourth column for direct comparison.
Current usage metrics show cumulative count of Article Views (full-text article views including HTML views, PDF and ePub downloads, according to the available data) and Abstracts Views on Vision4Press platform.
Data correspond to usage on the plateform after 2015. The current usage metrics is available 48-96 hours after online publication and is updated daily on week days.
Initial download of the metrics may take a while.