Fig. 6
Download original image
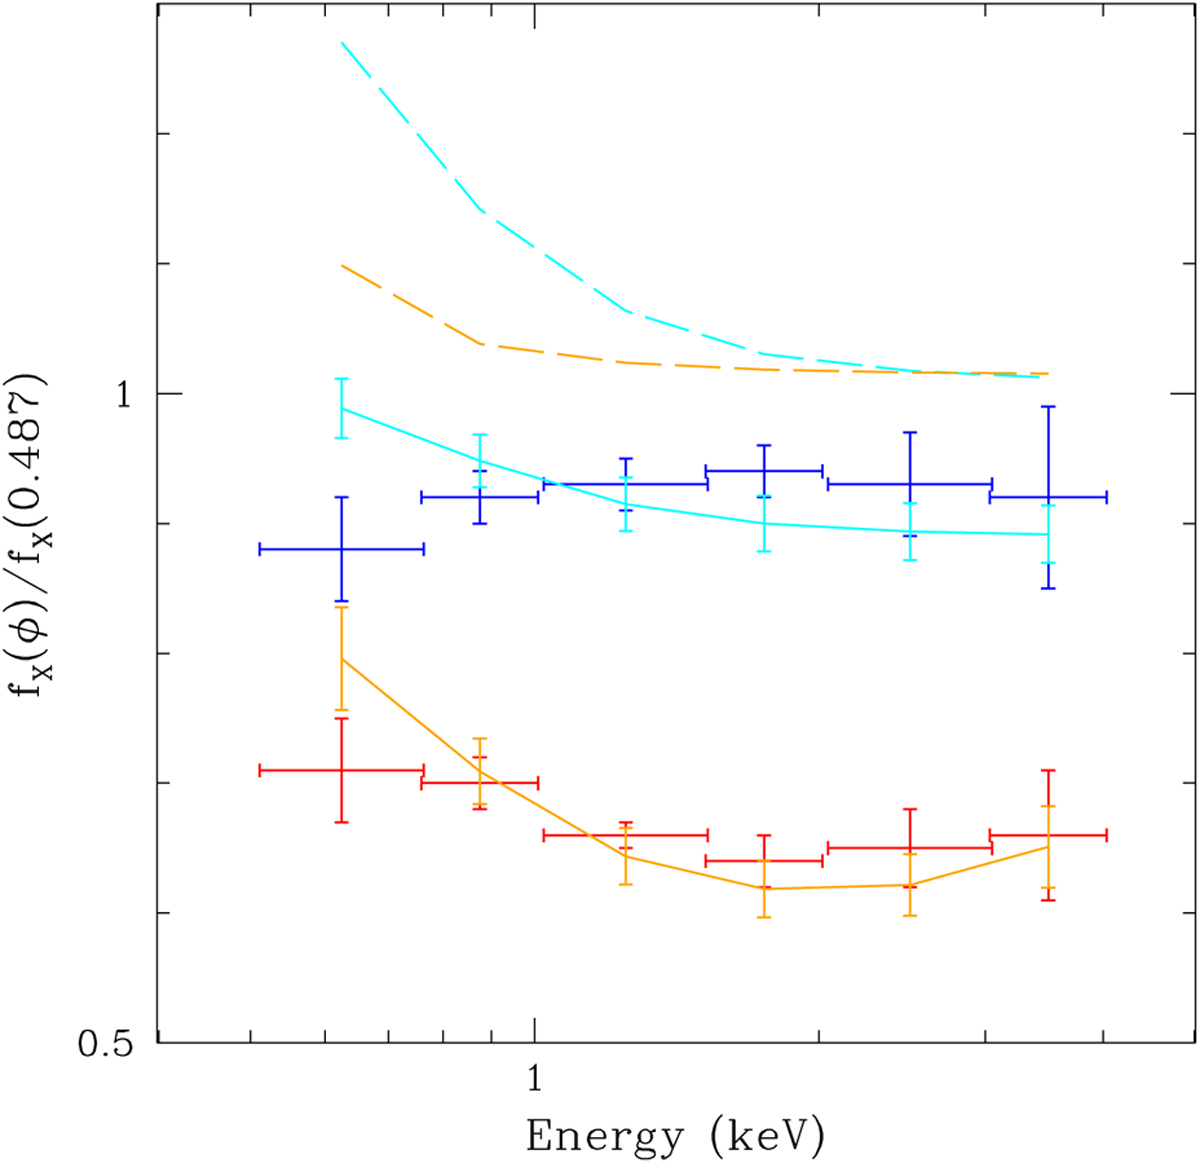
Comparison between the observed flux ratios and the best-fit predicted values for different models tested in this work. The red and blue symbols with error bars correspond respectively to the measured flux ratios displayed in Fig. 3. The orange and cyan curves yield the best-fit theoretical models for the phases shown respectively by the red and blue symbols. The continuous lines assume the X-rays arise entirely from the wind interaction zone of HD 149404 and using temperature and density profiles computed with the Cantó et al. (1996) model for an adiabatic wind interaction zone (Sect. 4.2). The long-dashed lines yield the results for X-rays arising entirely from wind-embedded shocks intrinsic to the primary and secondary stars (Sect. 4.3).
Current usage metrics show cumulative count of Article Views (full-text article views including HTML views, PDF and ePub downloads, according to the available data) and Abstracts Views on Vision4Press platform.
Data correspond to usage on the plateform after 2015. The current usage metrics is available 48-96 hours after online publication and is updated daily on week days.
Initial download of the metrics may take a while.