Fig. 2
Download original image
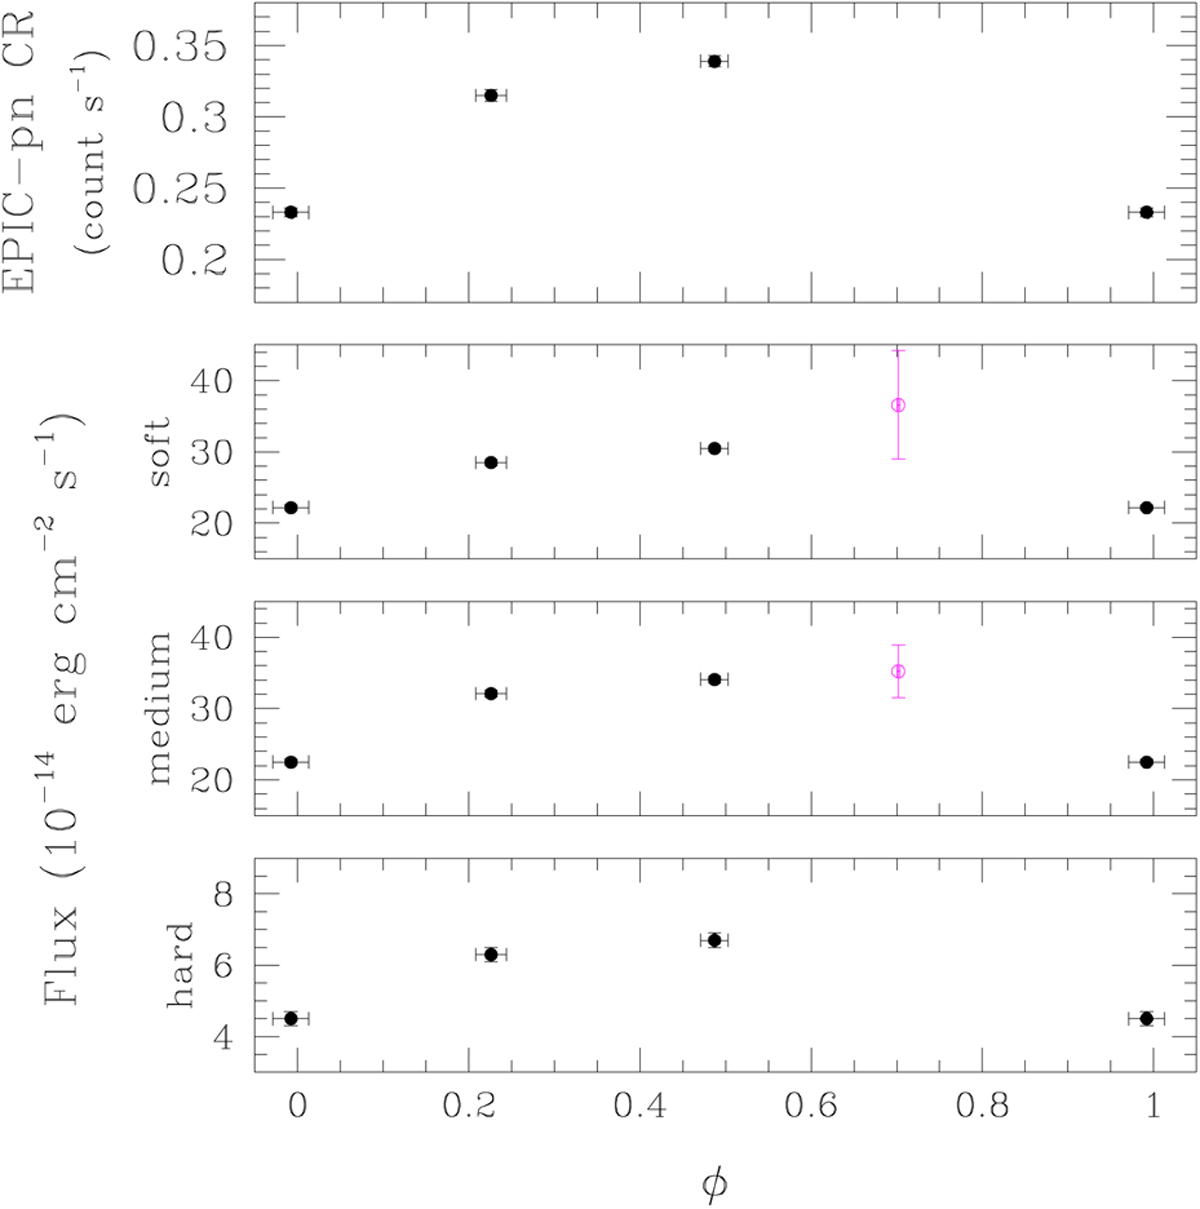
Variations of the X-ray emission of HD 149404 with orbital phase. From top to bottom, the panels illustrate the full EPIC-pn count rates for the different observations and the observed fluxes evaluated over three different energy bands: soft (0.5–1.0 keV), medium (1.0–2.0 keV), and hard (2.0–4.0 keV). The magenta symbols in the second and third panels correspond to the fluxes measured on an archival ROSAT-PSPC spectrum (Rauw et al. 2001).
Current usage metrics show cumulative count of Article Views (full-text article views including HTML views, PDF and ePub downloads, according to the available data) and Abstracts Views on Vision4Press platform.
Data correspond to usage on the plateform after 2015. The current usage metrics is available 48-96 hours after online publication and is updated daily on week days.
Initial download of the metrics may take a while.