Fig. 1
Download original image
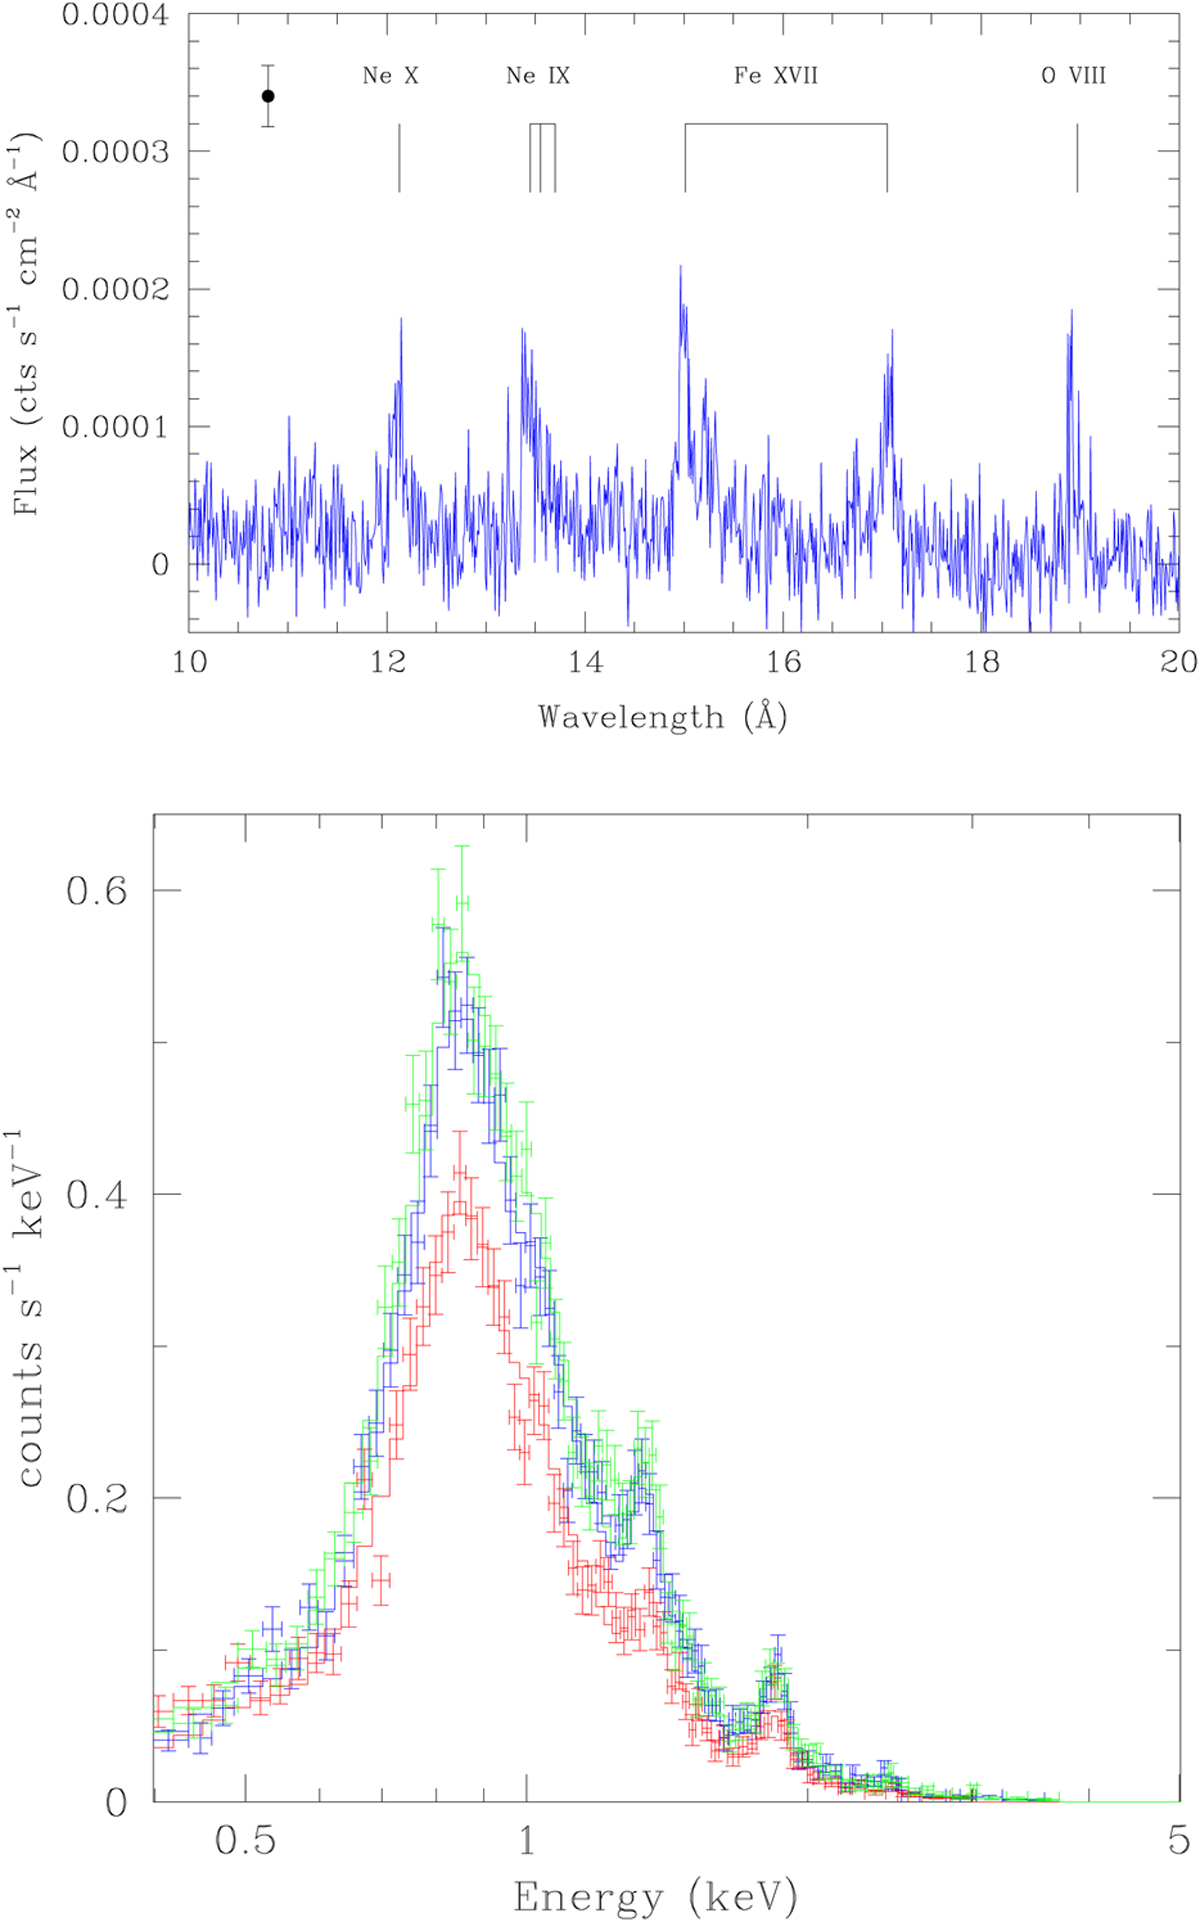
X-ray spectra of HD 149404. Top panel: combined RGS (RGS1 + RGS2, first and second orders, all three observations) spectrum of HD 149404. The labels indicate the lines that are apparent in this spectrum. The error bar in the top left corner indicates the mean error on the energy bins in the combined RGS spectrum between 10 Å and 20 Å. Bottom panel: comparison of the EPIC-pn spectra of HD 149404 during the three observations. The first observation (φ = 0.227) is shown in blue, the second (φ = 0.992) in red, and the third (φ = 0.487) in green.
Current usage metrics show cumulative count of Article Views (full-text article views including HTML views, PDF and ePub downloads, according to the available data) and Abstracts Views on Vision4Press platform.
Data correspond to usage on the plateform after 2015. The current usage metrics is available 48-96 hours after online publication and is updated daily on week days.
Initial download of the metrics may take a while.