Open Access
Fig. 9
Download original image
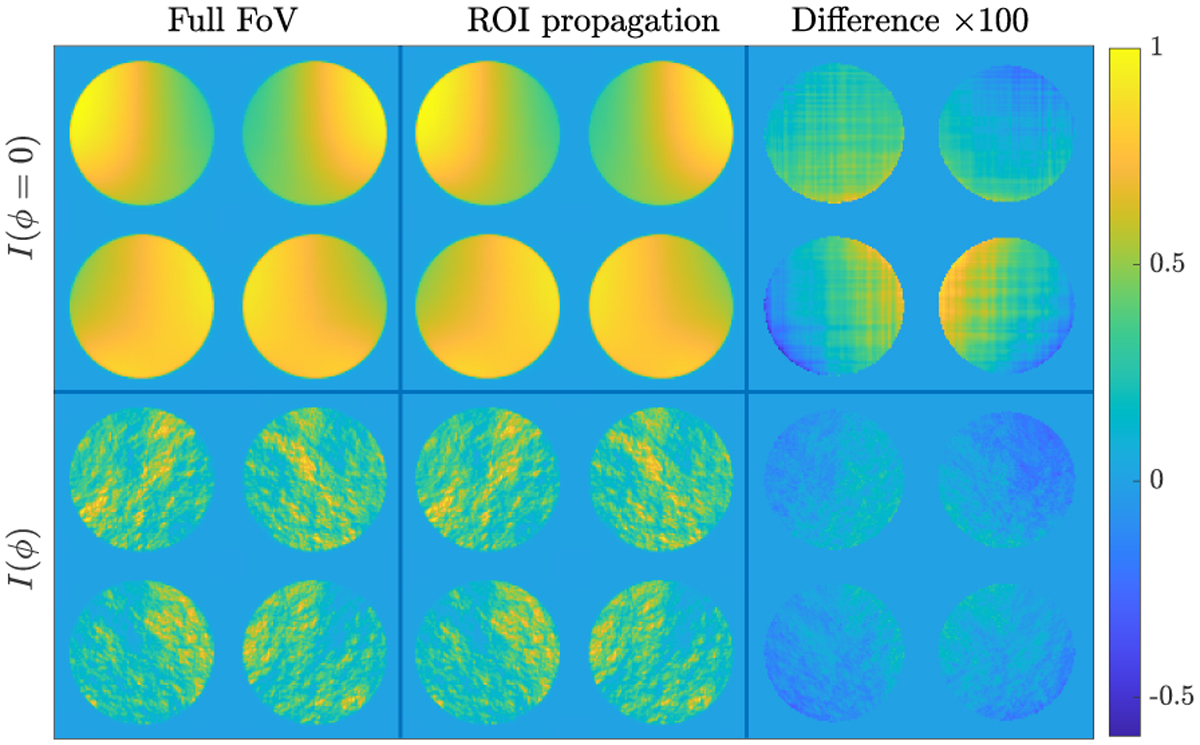
Comparison between the full FoV propagation and the ROI propagation. Left column: full simulation considering the complete FoV for each sample. Middle column: ROI propagation. Right column: 100 times the difference between the two. Top row: Intensity for a flat wavefront. Bottom row: intensity considering atmosphere
Current usage metrics show cumulative count of Article Views (full-text article views including HTML views, PDF and ePub downloads, according to the available data) and Abstracts Views on Vision4Press platform.
Data correspond to usage on the plateform after 2015. The current usage metrics is available 48-96 hours after online publication and is updated daily on week days.
Initial download of the metrics may take a while.