Fig. 4
Download original image
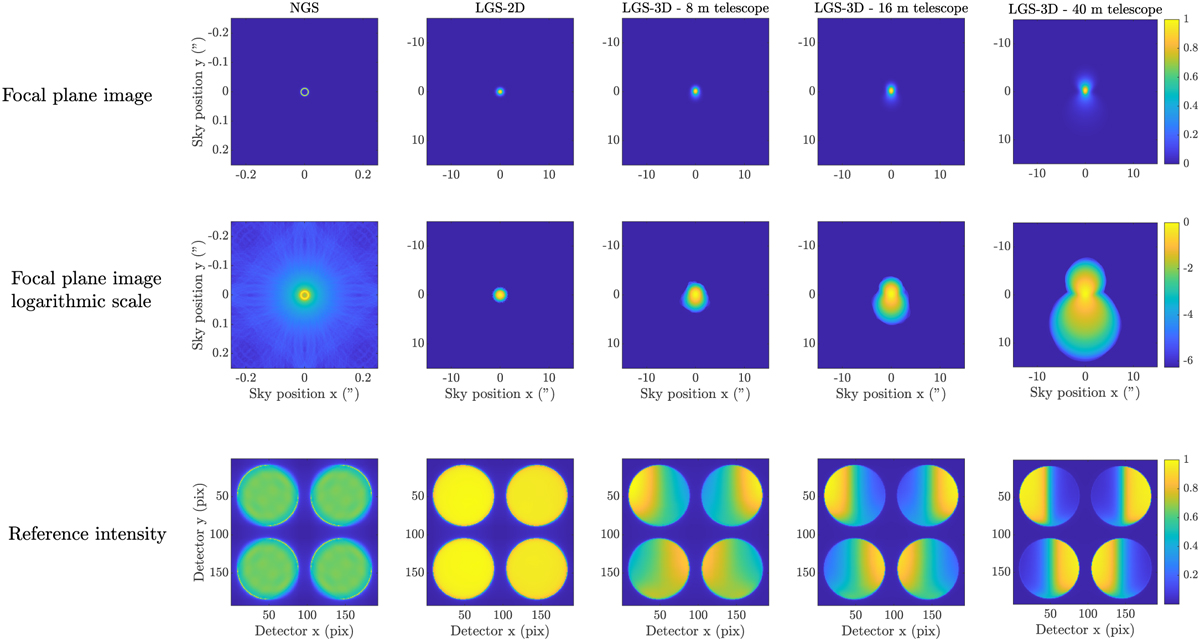
Focal plane images of the tested sources, and their illumination pattern on the detector. From left to right, the simulations correspond to a 4 λ/D modulated NGS for a 40 m telescope, LGS-2D, and LGS-3D for 8, 16, and 40 m telescopes. Top row: Focal plane images. The scale is normalized such that the maximum pixel value in each image is one. Middle row: Focal plane images with a logarithmic stretch for better visualization. Bottom row: Intensities in the detector of the wavefront sensor for a flat wavefront. The intensities are normalized such that the maximum pixel value is one. We note that the field of view for the NGS corresponds to 0.4 arcsec, meanwhile, for the extended sources, the field of view is 30 arcsec. The last column includes a color bar that is valid for the whole row.
Current usage metrics show cumulative count of Article Views (full-text article views including HTML views, PDF and ePub downloads, according to the available data) and Abstracts Views on Vision4Press platform.
Data correspond to usage on the plateform after 2015. The current usage metrics is available 48-96 hours after online publication and is updated daily on week days.
Initial download of the metrics may take a while.