Open Access
Fig. 15
Download original image
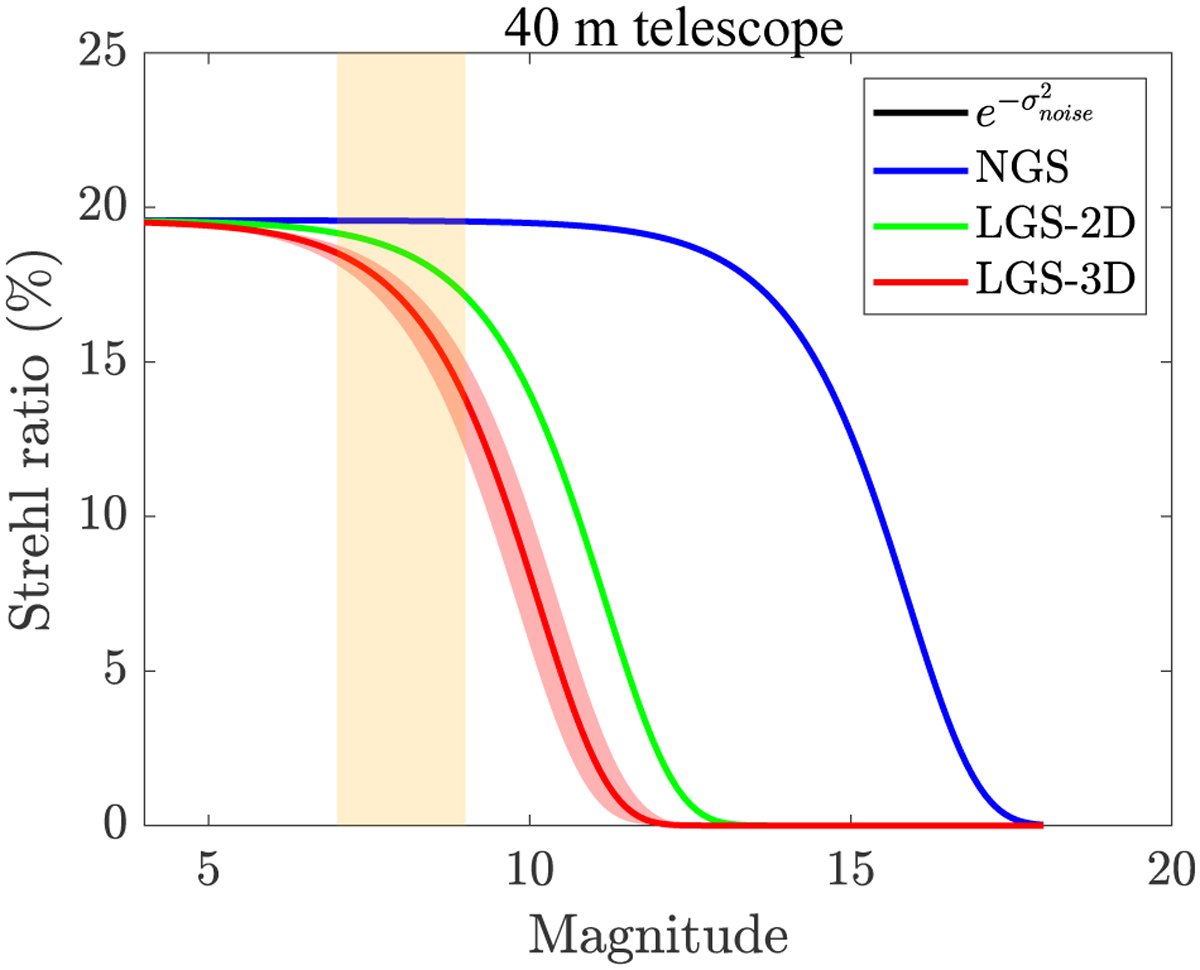
Sensitivity predictions of closed-loop performance for a 40 m telescope. For the LGS-3D, the solid line corresponds to the average performance across all sodium profiles and the shaded region is limited by the maximum and minimum performance given all sodium profiles.
Current usage metrics show cumulative count of Article Views (full-text article views including HTML views, PDF and ePub downloads, according to the available data) and Abstracts Views on Vision4Press platform.
Data correspond to usage on the plateform after 2015. The current usage metrics is available 48-96 hours after online publication and is updated daily on week days.
Initial download of the metrics may take a while.