Fig. 14
Download original image
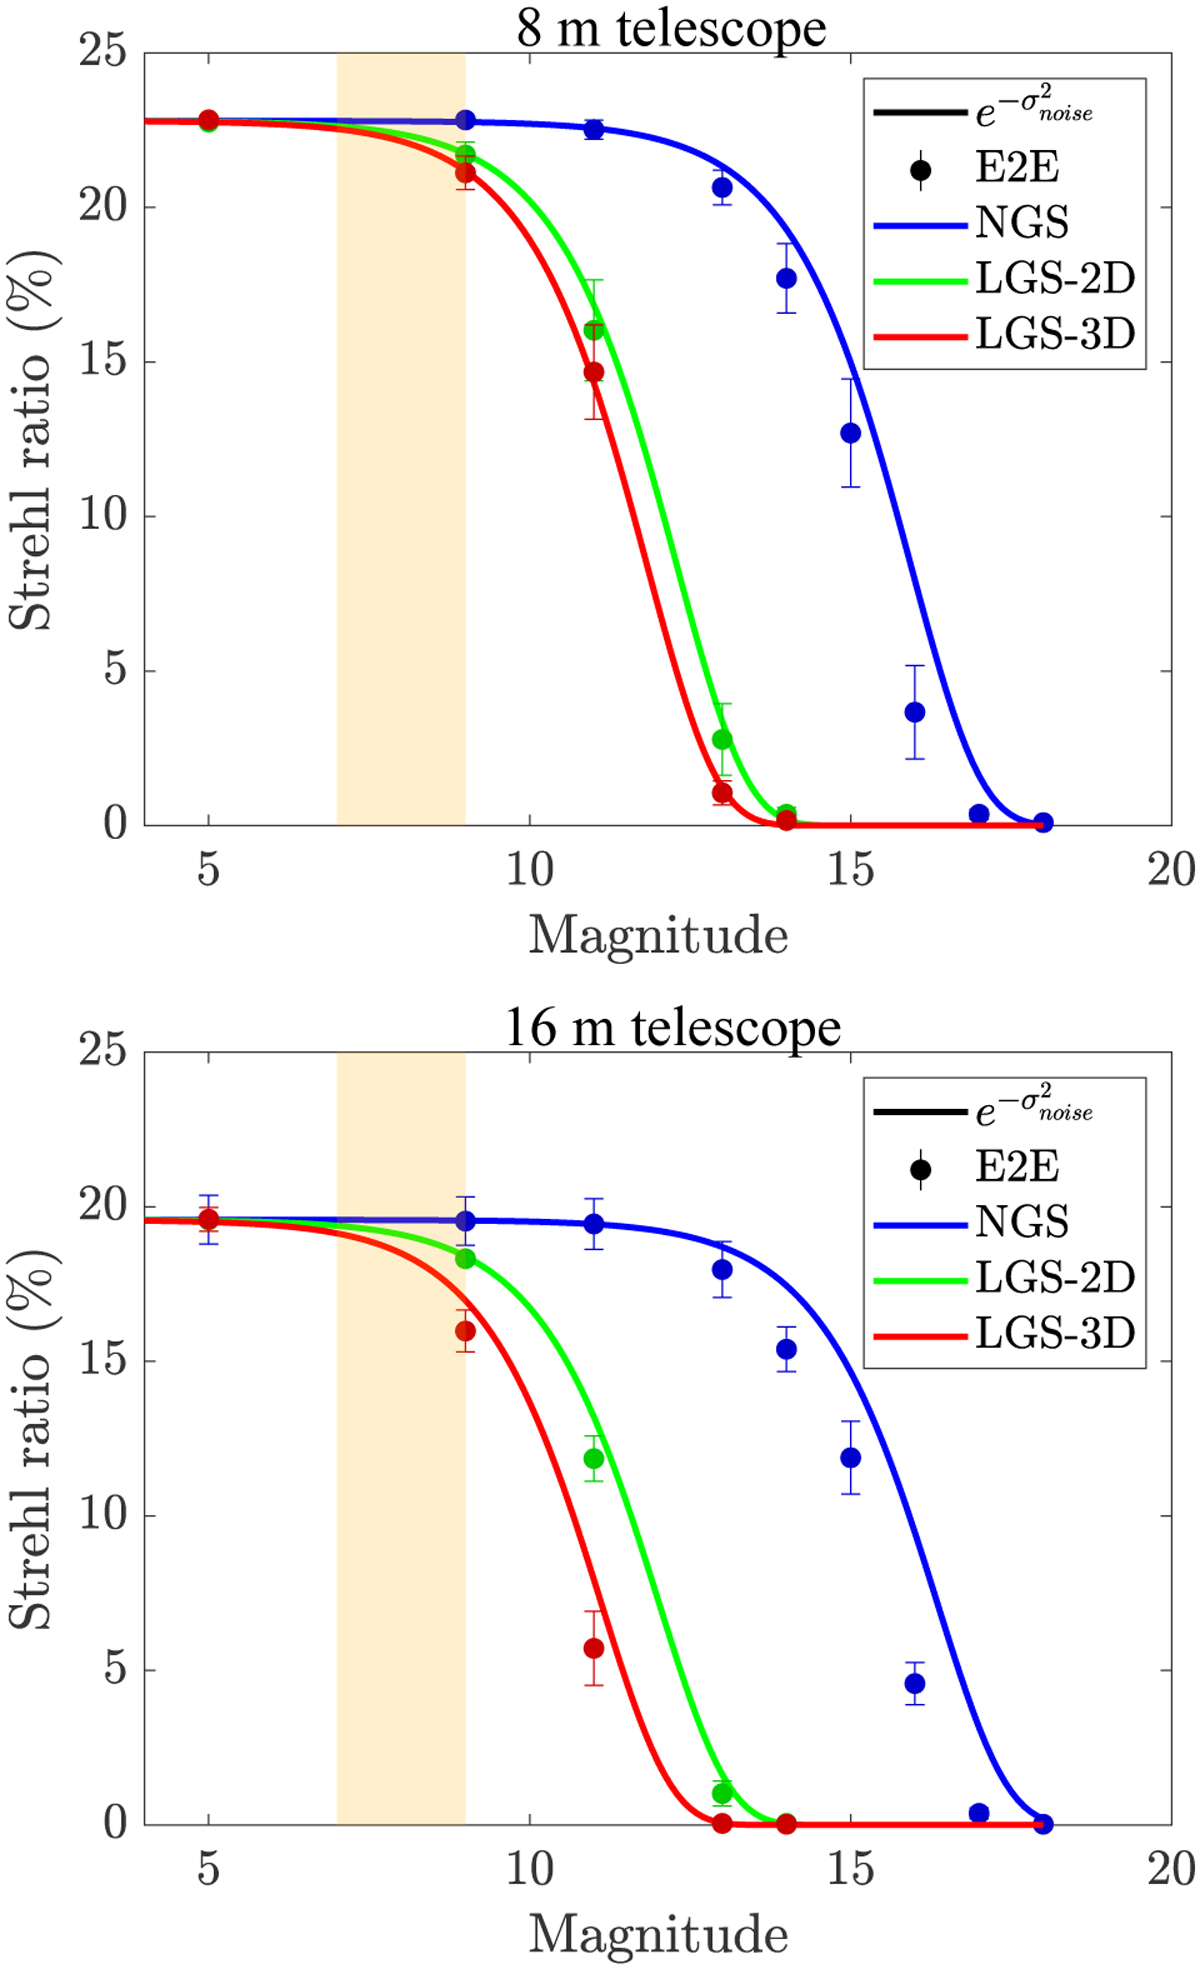
Strehl ratio for E2E simulations (markers) and sensitivity predictions (solid lines) of closed-loop performance for 8 (top plot) and 16 m (bottom plot) telescopes. ![]() corresponds to the residual variance predicted by fitting error and photon noise for NGS, LGS-2D, and LGS-3D. The yellow stripe corresponds to the expected return flux of the LGSs for the ELT.
corresponds to the residual variance predicted by fitting error and photon noise for NGS, LGS-2D, and LGS-3D. The yellow stripe corresponds to the expected return flux of the LGSs for the ELT.
Current usage metrics show cumulative count of Article Views (full-text article views including HTML views, PDF and ePub downloads, according to the available data) and Abstracts Views on Vision4Press platform.
Data correspond to usage on the plateform after 2015. The current usage metrics is available 48-96 hours after online publication and is updated daily on week days.
Initial download of the metrics may take a while.