Fig. 7
Download original image
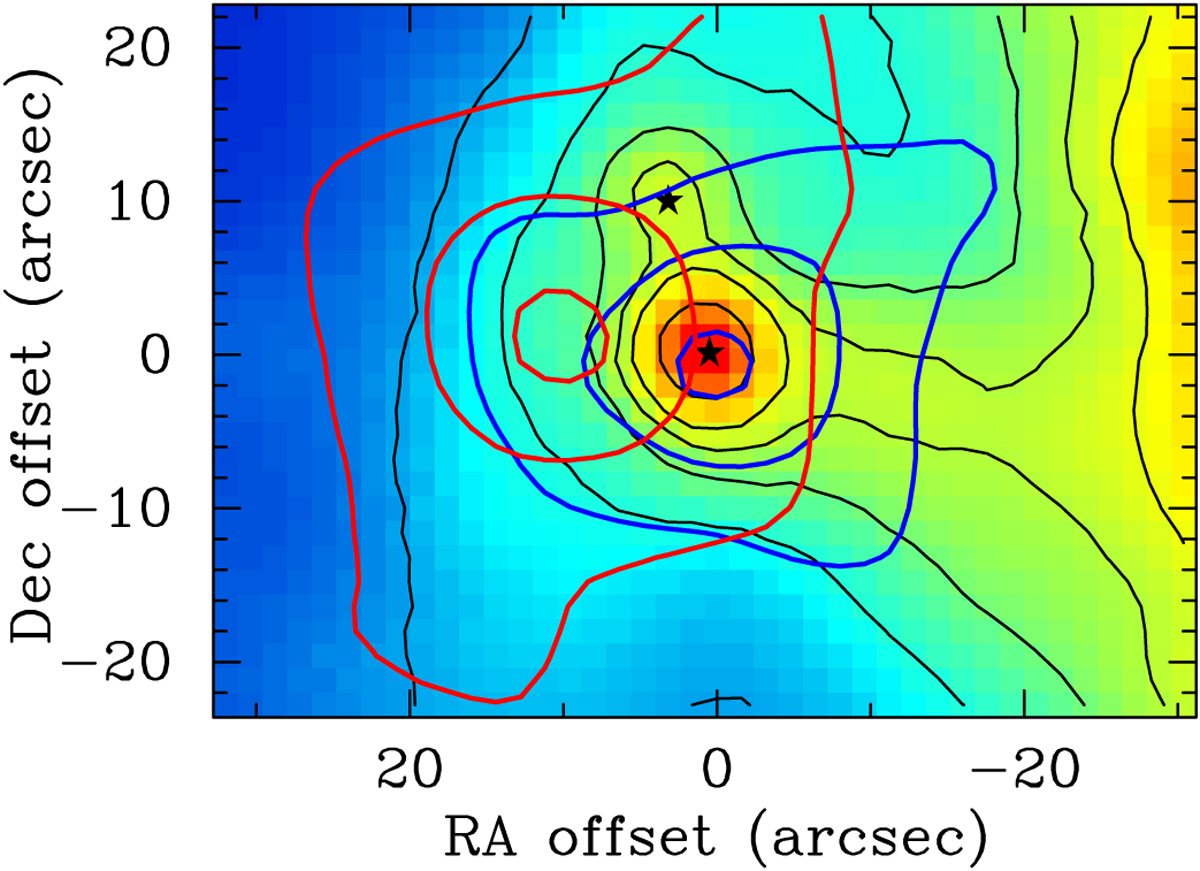
High-velocity emission of CO(6−5) overlaid on a 100 µm PACS image in color. The blueshifted CO is integrated from +6 to +8 km s−1, and the redshifted CO is integrated from 13–15 km s−1. This CO(6−5) map was created with the same angular resolution as CO(4−3) or 14″.4. MIR-73 is placed at an offset 0″, 0″, and MIR-75 is ~12″ north of it. Both are marked by black stars.
Current usage metrics show cumulative count of Article Views (full-text article views including HTML views, PDF and ePub downloads, according to the available data) and Abstracts Views on Vision4Press platform.
Data correspond to usage on the plateform after 2015. The current usage metrics is available 48-96 hours after online publication and is updated daily on week days.
Initial download of the metrics may take a while.