Open Access
Fig. 6
Download original image
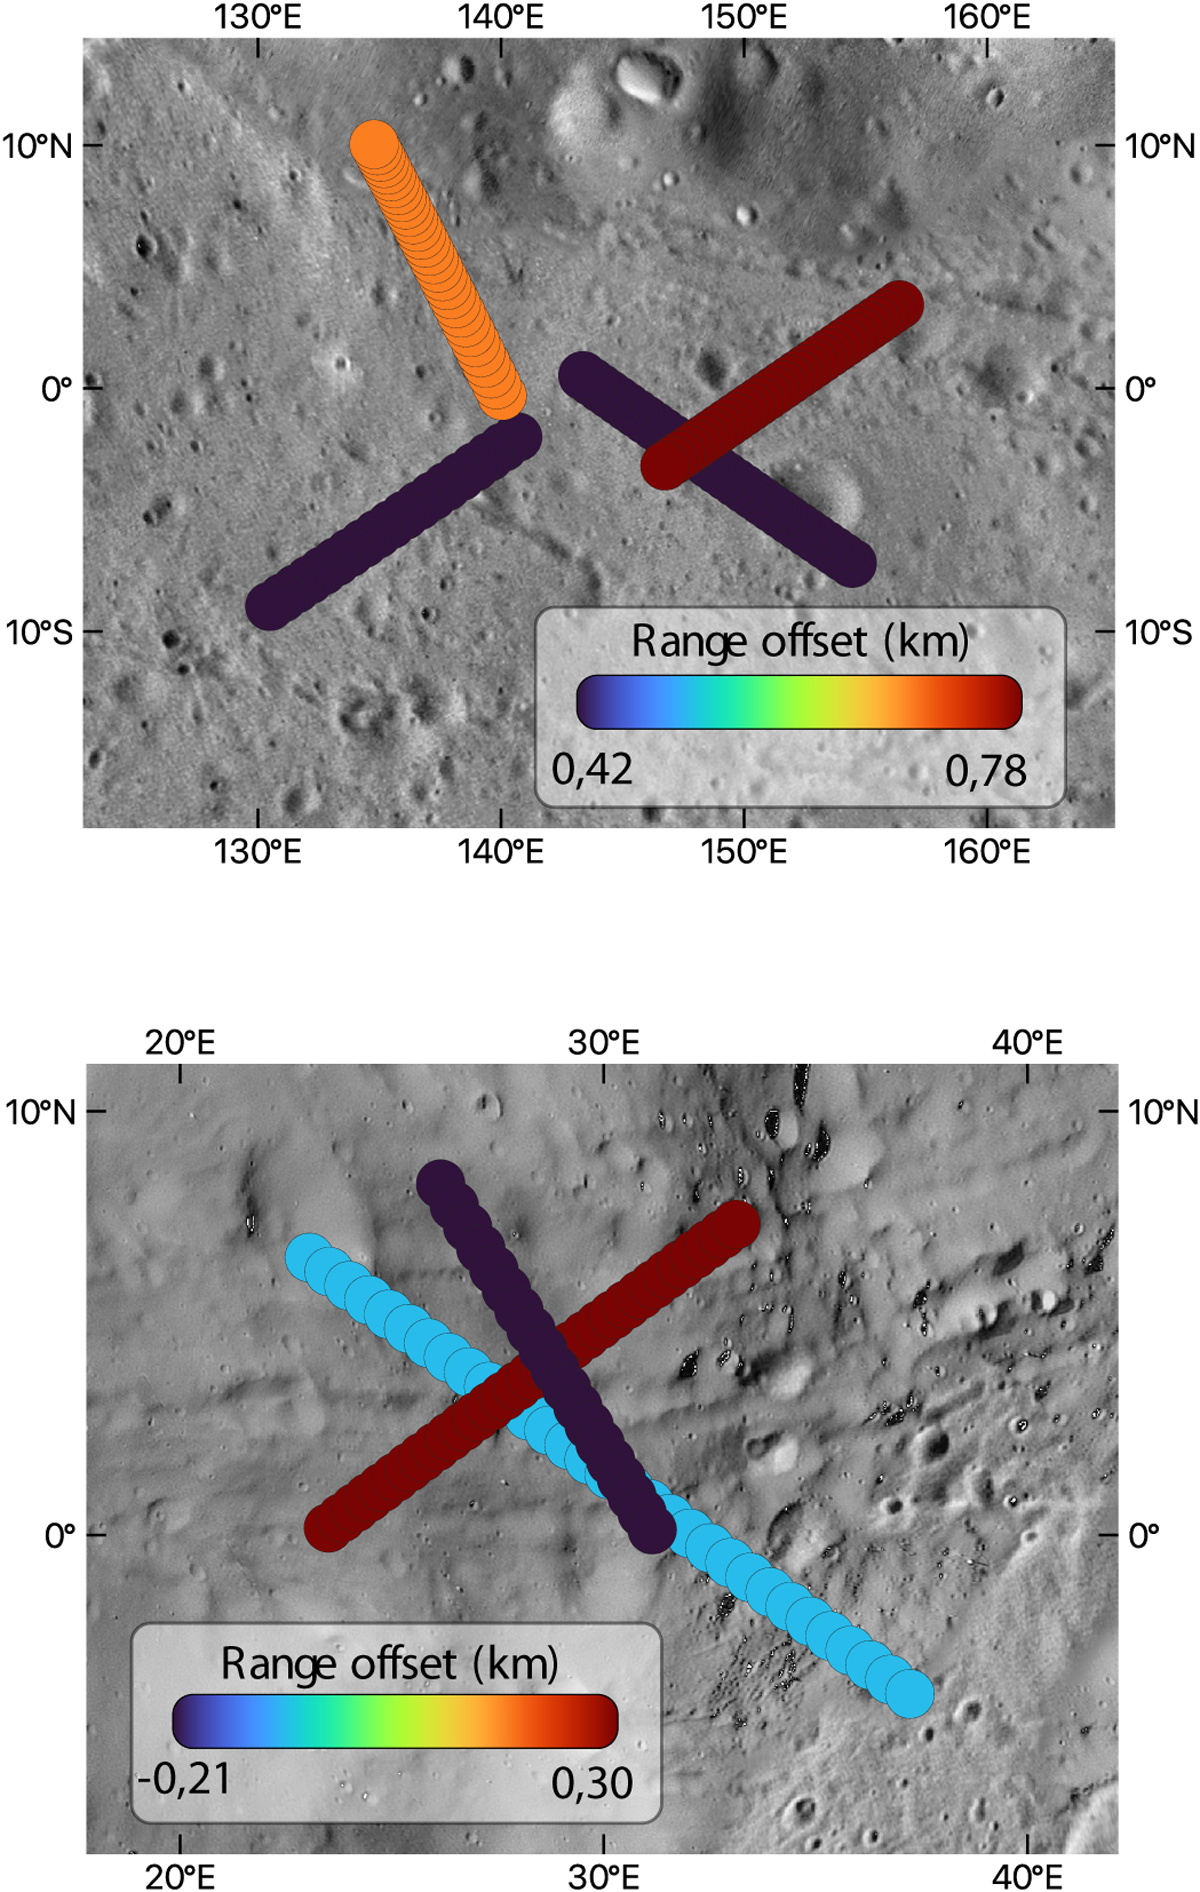
Zoom onto an area where several tracks cross. We can see that orbits crossing each other do not have the same offset value, meaning that the shape model is not the only source of error. Background map taken from Stooke (2015).
Current usage metrics show cumulative count of Article Views (full-text article views including HTML views, PDF and ePub downloads, according to the available data) and Abstracts Views on Vision4Press platform.
Data correspond to usage on the plateform after 2015. The current usage metrics is available 48-96 hours after online publication and is updated daily on week days.
Initial download of the metrics may take a while.