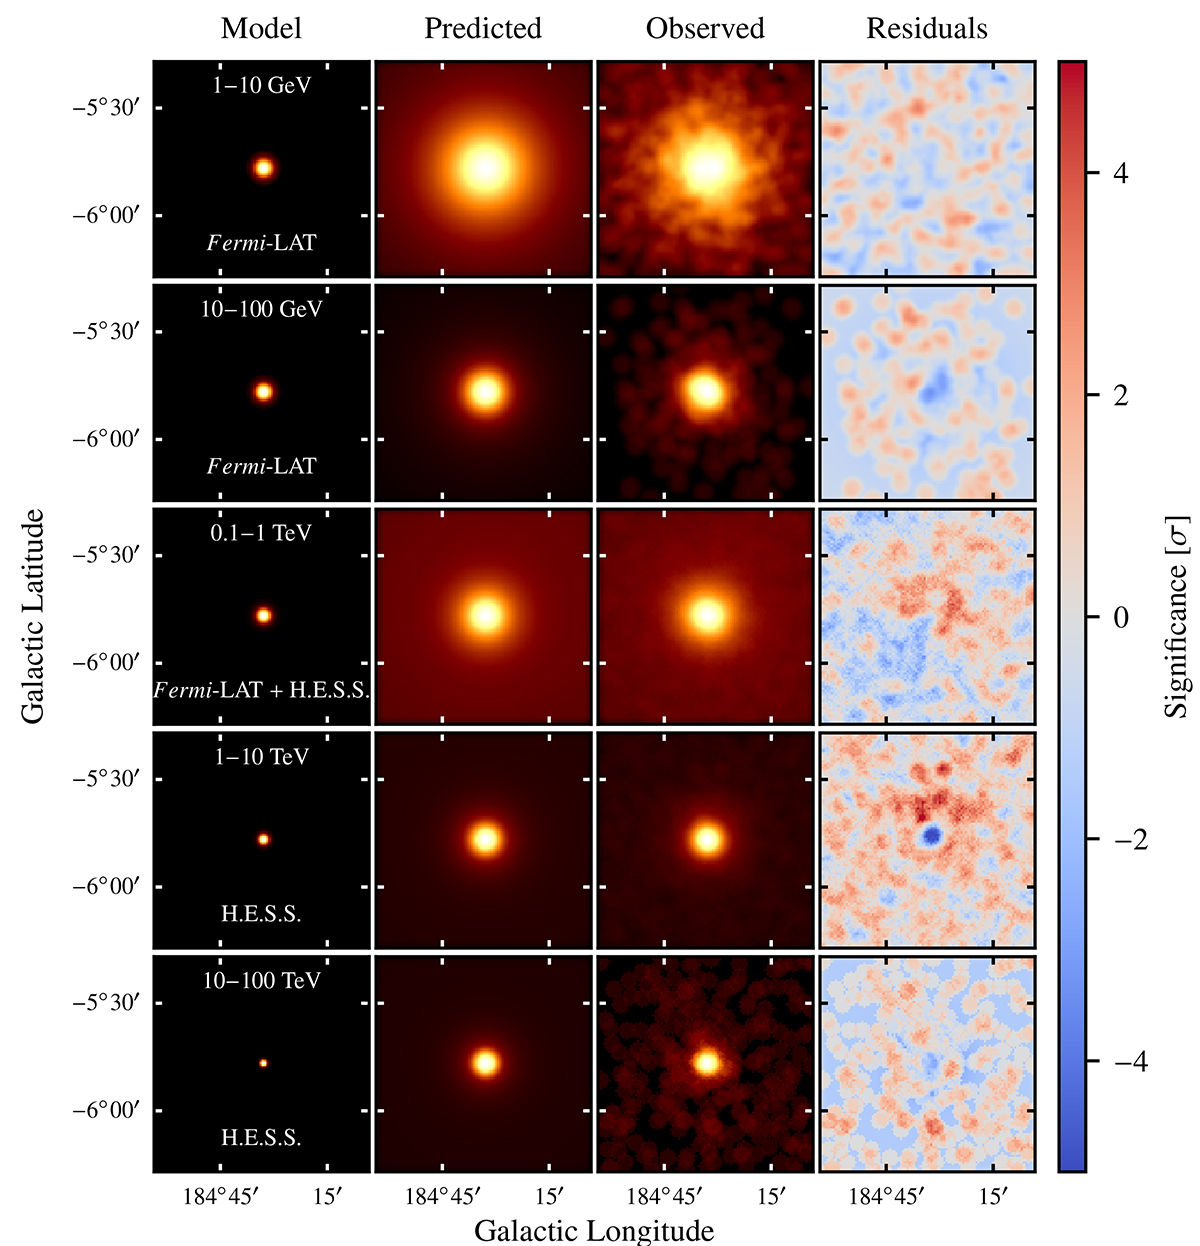
Fig. 9.
Download original image
Overview showing the best-fit variable B-field model and the observed data in the IC regime, in five different energy bands. Each panel displays a 1° ×1° cutout around the position of the Crab Nebula. The first column gives the best-fit model prior to folding with the IRFs. The second column illustrates the predicted number of events based on source and background models (folded with the IRFs), smoothed with a top-hat kernel of 2.4′ radius. The third column shows the observed number of events with the same smoothing. Finally, the fourth column displays residual significance maps (see main text for details).
Current usage metrics show cumulative count of Article Views (full-text article views including HTML views, PDF and ePub downloads, according to the available data) and Abstracts Views on Vision4Press platform.
Data correspond to usage on the plateform after 2015. The current usage metrics is available 48-96 hours after online publication and is updated daily on week days.
Initial download of the metrics may take a while.