Open Access
Fig. 4.
Download original image
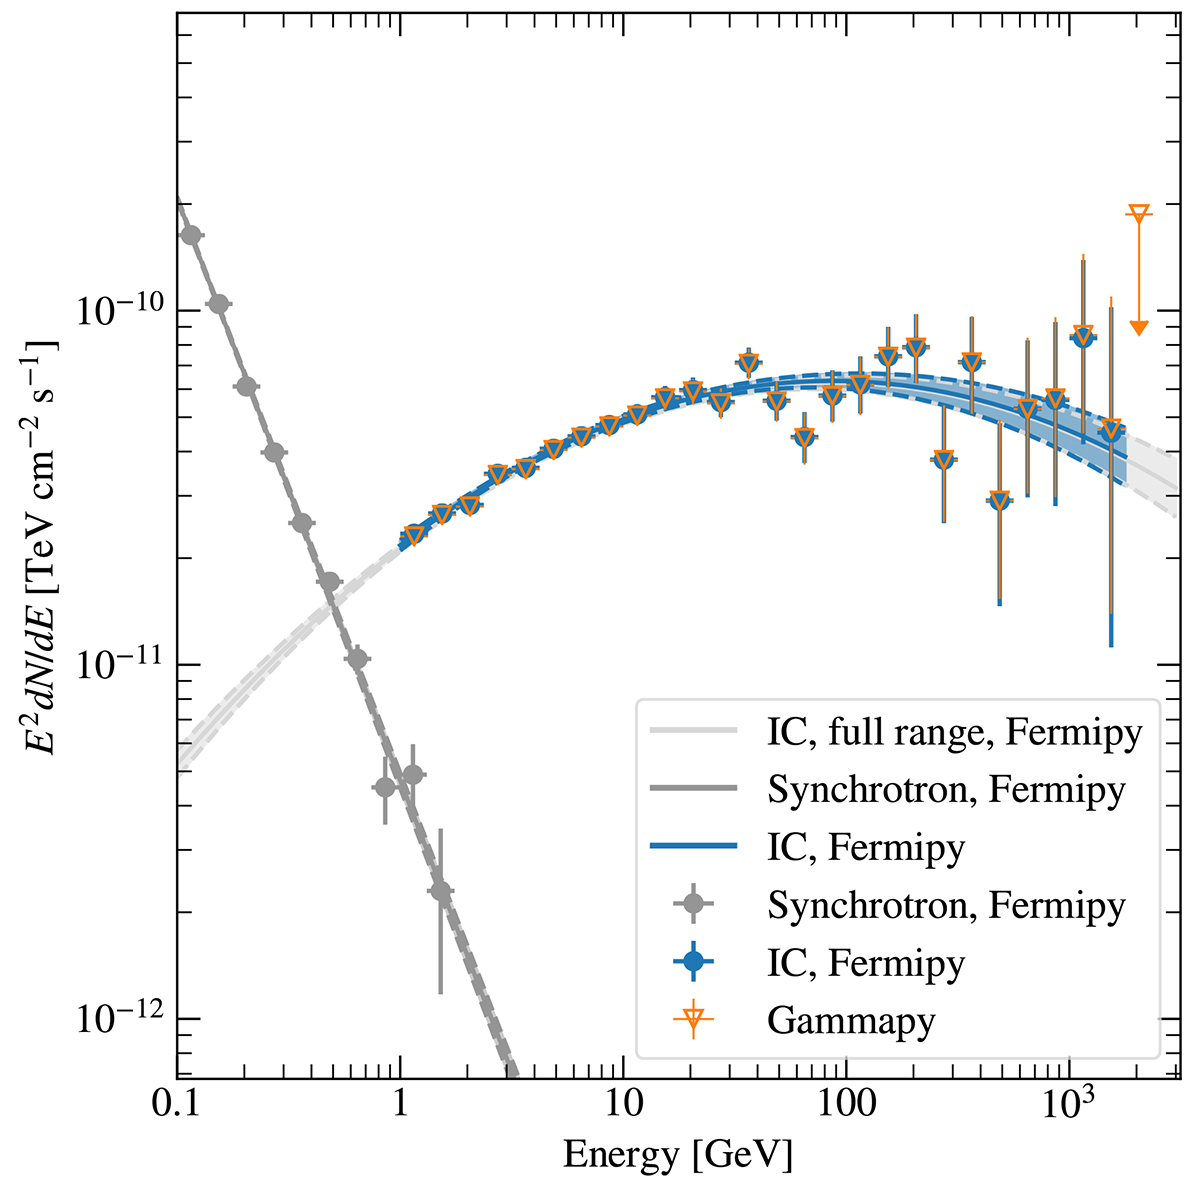
Fermi-LAT spectra of synchrotron and IC emission. The IC emission is derived with both FERMIPY and GAMMAPY and the spectra agree remarkably well. Details on the GAMMAPY analysis of Fermi-LAT data are given in Sect. 3.1. The error bars on the flux points show the 68% statistical uncertainties.
Current usage metrics show cumulative count of Article Views (full-text article views including HTML views, PDF and ePub downloads, according to the available data) and Abstracts Views on Vision4Press platform.
Data correspond to usage on the plateform after 2015. The current usage metrics is available 48-96 hours after online publication and is updated daily on week days.
Initial download of the metrics may take a while.