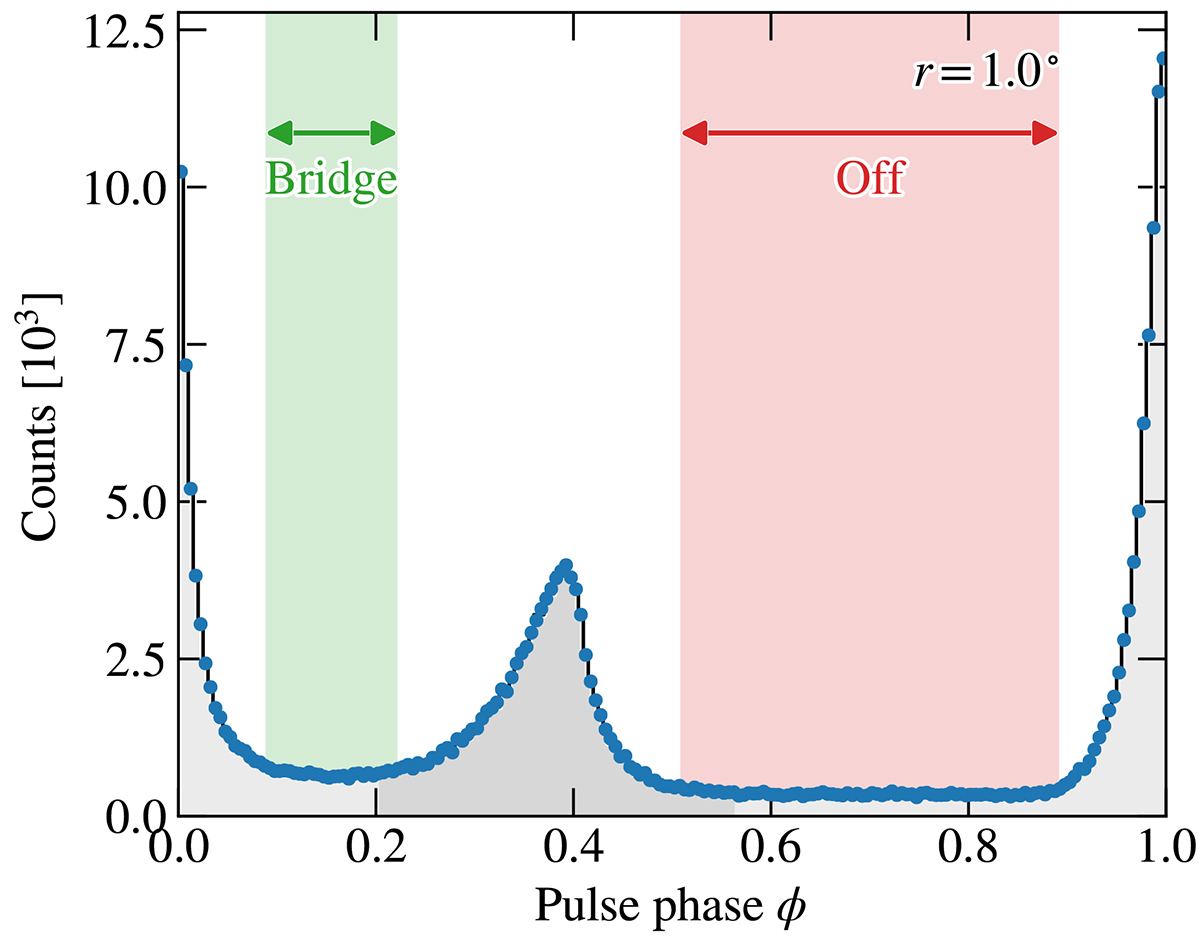
Fig. 3.
Download original image
Distribution of pulsar phases of γ-ray candidate events detected with Fermi-LAT around the Crab Nebula. The distribution includes events with a reconstructed arrival direction that is within 1° of the Crab Nebula’s position. The shaded regions indicate the intervals for the Bridge emission (0.09 ≤ ϕ ≤ 0.22, not relevant here) and Off region (0.51 ≤ ϕ ≤ 0.89) derived with the QB algorithm. The grey shaded areas indicate regions found by the HOP algorithm, which identifies “watersheds” between local maxima (Meyer et al. 2019). There are shown here for illustration only.
Current usage metrics show cumulative count of Article Views (full-text article views including HTML views, PDF and ePub downloads, according to the available data) and Abstracts Views on Vision4Press platform.
Data correspond to usage on the plateform after 2015. The current usage metrics is available 48-96 hours after online publication and is updated daily on week days.
Initial download of the metrics may take a while.