Fig. 2.
Download original image
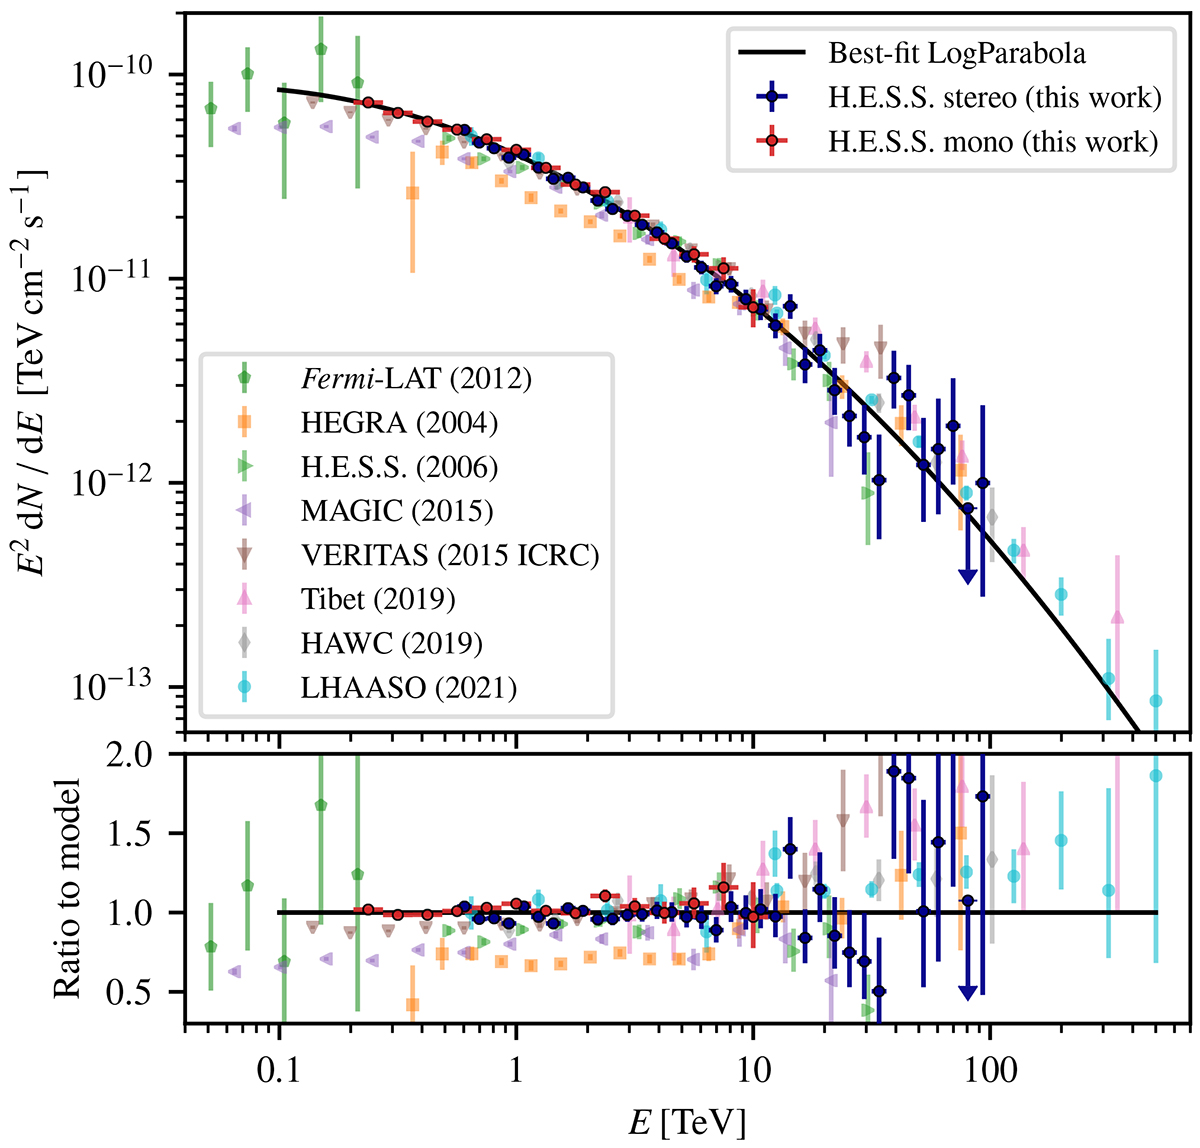
H.E.S.S. flux points of the mono (CT5) analysis (red) and stereo (CT1-4) analysis (blue) in comparison to results from other instruments. The error bars show the 68% statistical uncertainty. Points less significant than 2σ are shown as 95% confidence level upper limits. The black line displays the result of fitting a log-parabola model to the H.E.S.S. data of this work. References (in the order of the legend): Aharonian et al. (2004, 2006), Aleksić et al. (2015), Meagher (2015), Amenomori et al. (2019), Abeysekara et al. (2019), and Cao et al. (2021).
Current usage metrics show cumulative count of Article Views (full-text article views including HTML views, PDF and ePub downloads, according to the available data) and Abstracts Views on Vision4Press platform.
Data correspond to usage on the plateform after 2015. The current usage metrics is available 48-96 hours after online publication and is updated daily on week days.
Initial download of the metrics may take a while.